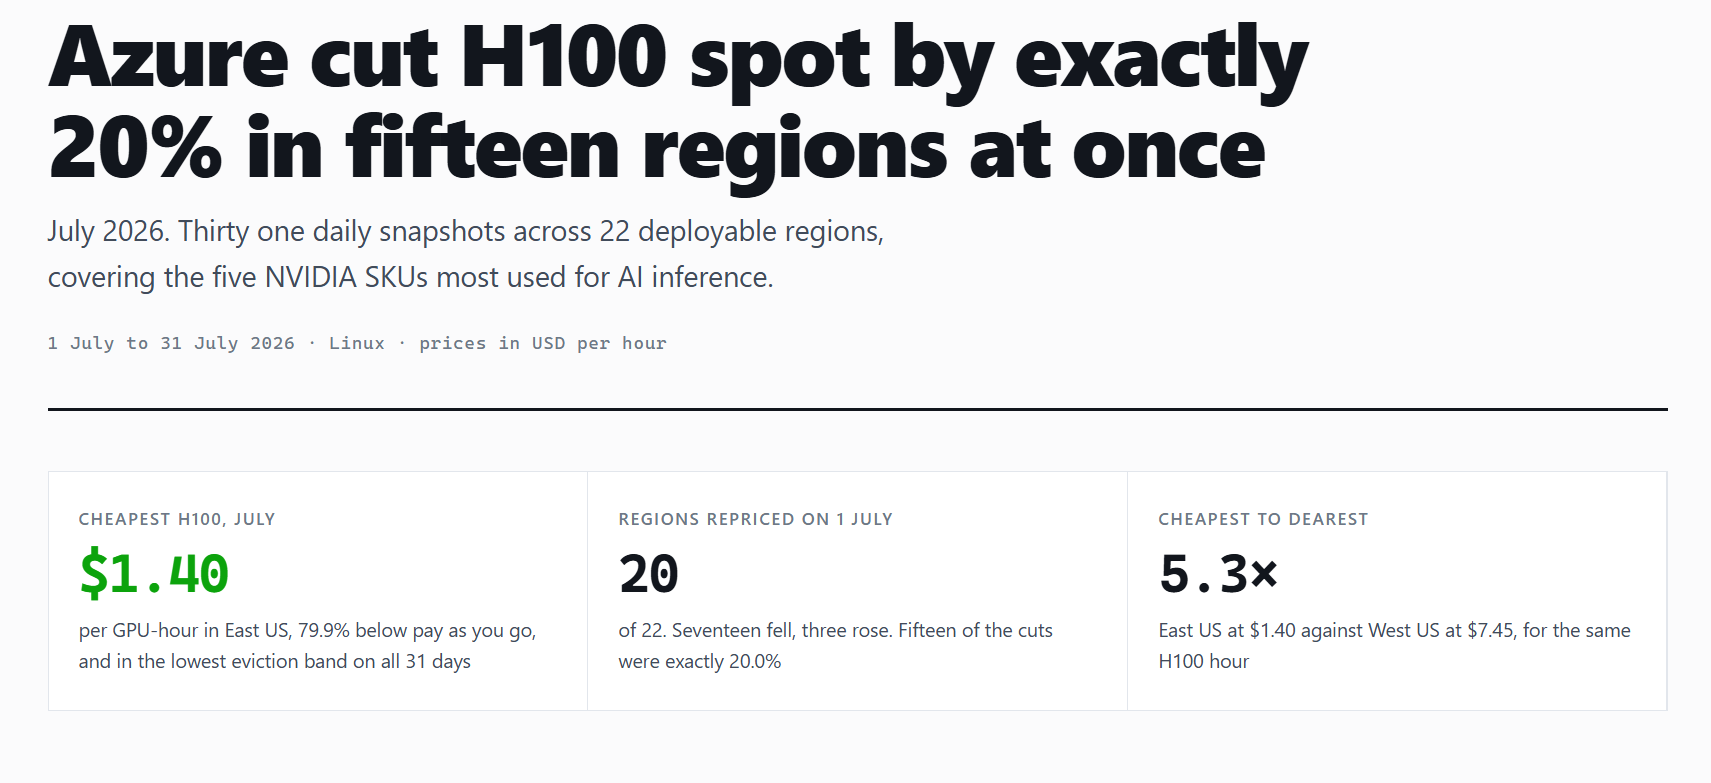
On 1 July, Azure repriced H100 spot in 20 of its 22 deployable regions. Seventeen fell, three rose, and fifteen of the cuts were exactly 20.0%: same day, same percentage, same direction. We snapshot spot prices and eviction bands daily across ~1,500 SKU-region combinations. Here's the July cut for the five VMs you'd actually run AI inference on, including the full tables.
Same ground rules as June's report: the five NC-series SKUs that matter for inference, NC40ads and NC80adis (1x and 2x H100) and NC24/48/96ads (1x, 2x and 4x A100). 22 deployable regions, Linux pricing, and this month a full 31 daily snapshots against June's 26.
The standing honesty note: the eviction figures are Azure's own published estimates, read daily and averaged at band midpoints. They're Azure's risk statement, not our counted interruptions. Treat the report as a map from one instrument, and if your experience in a region differs from what the data shows, we genuinely want to hear it.
Four findings this month.
1. One price move, made everywhere at once
Azure doesn't drift GPU spot prices day to day. It holds them flat for a calendar month and resets on the first. June's report described the pattern; July delivered the cleanest demonstration yet. Fifteen regions moved by precisely the same 20.0%, on the same day, in the same direction. Three regions went the other way, each by exactly 10.0%: Central US, Canada Central and West US 3. Two didn't move at all.
Nothing happened mid-month. Across 250 SKU/region combinations tracked daily through July, not one showed a second price inside the month. If you're modelling Azure spot as a live auction that responds to demand hour by hour, it's worth knowing it behaves more like a price list that gets rewritten monthly.
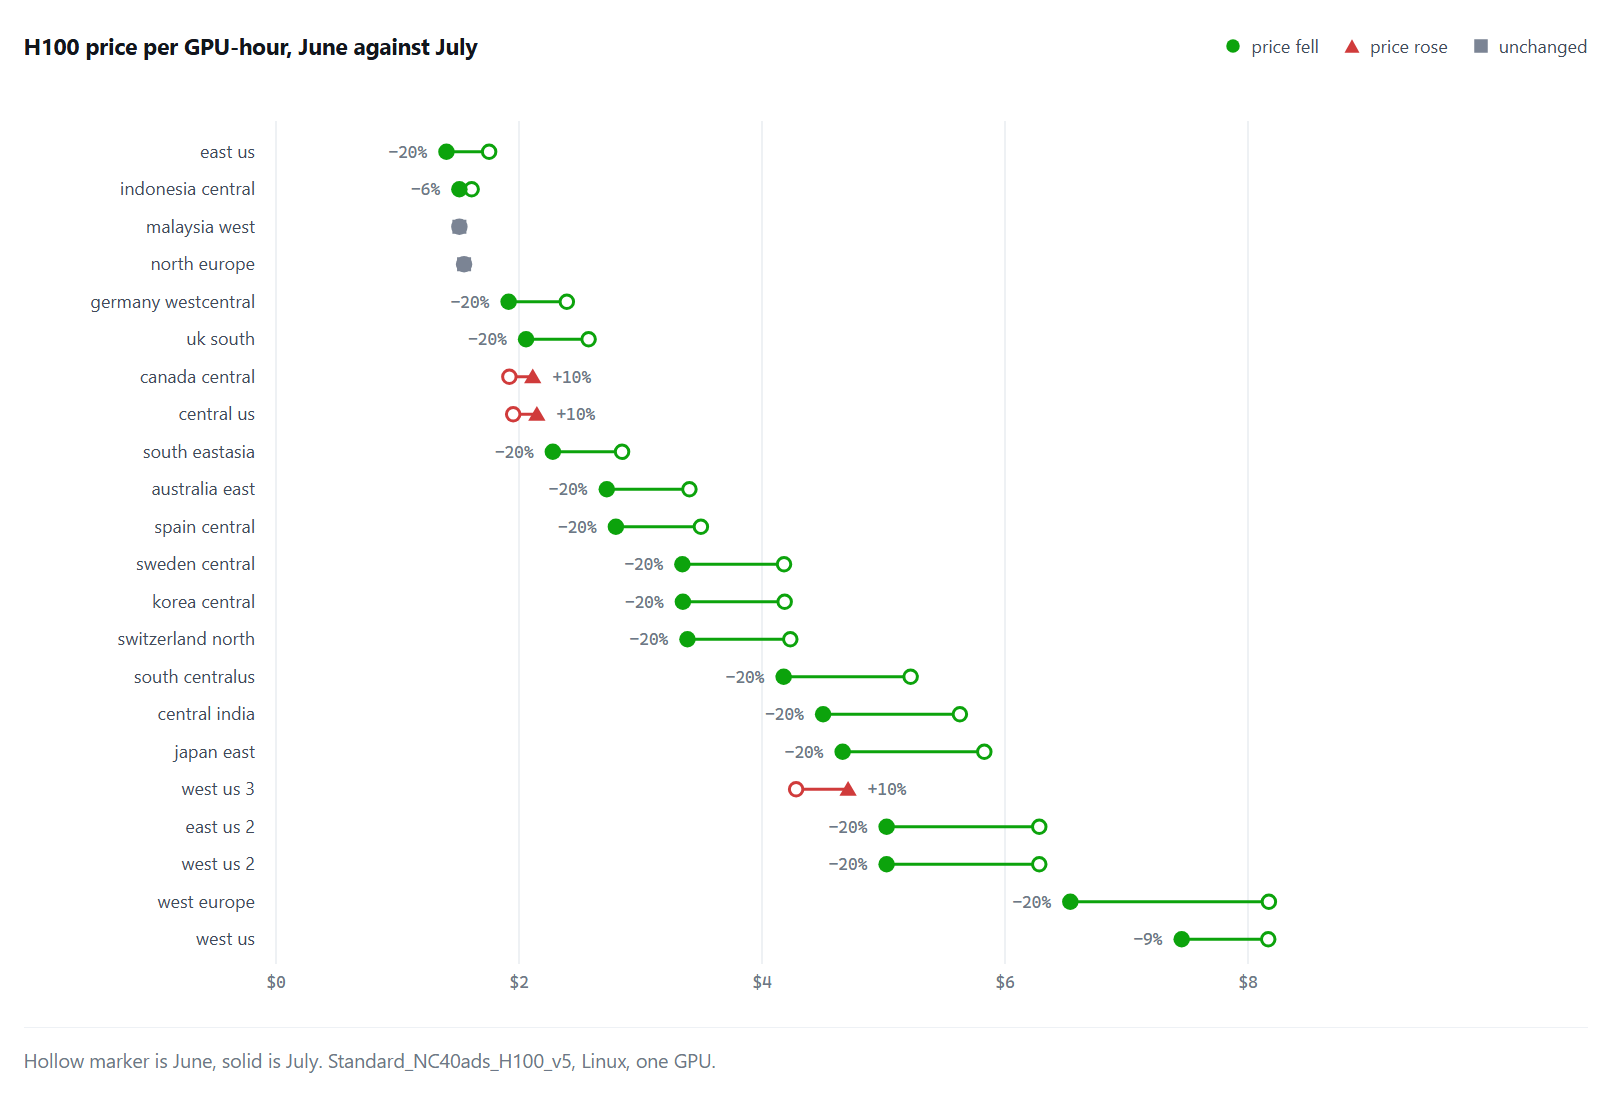
The practical consequence is the same one June taught: within a month, timing buys you nothing. Check prices on the 1st, then spend your attention on where to deploy.
2. The cheapest region is now also the safest
The standing rule of spot is that cheap means reclaimable: the discount compensates you for eviction risk. July broke the rule. East US priced the H100 at $1.40/GPU-hour, the cheapest on the map at 79.9% below pay-as-you-go, while sitting in Azure's lowest published eviction band (0-5%) on every one of the 31 days.
That's a double move. In June, East US cost $1.75 and sat in the 15%+ band in 24 of 26 snapshots: cheap-ish, twitchy. In July it took a 20% cut and went calm, displacing June's value pick, Malaysia West ($1.51, unchanged in July, and a useful control on the method). Meanwhile the expensive end stayed expensive: the same H100 hour costs $7.45 in West US. A 5.3x spread for identical silicon.
3. June's bigger-box trick runs backwards on A100s
June's most useful finding was that the 2x H100 box gets evicted far less than the 1x at the same per-GPU price. July confirms it on H100s: the 2x sat in a lower band than the 1x in 15 of 22 regions.
June's report also suggested the same pattern showed in the A100 family. With a full month of retained history, we have to take that back. On A100s, eviction rises with box size in 16 of 20 regions. East US 2 reads 9.4% on the 1x, 22.5% on the 2x, 22.5% on the 4x (band midpoints). Same month, same method, opposite sizing advice.
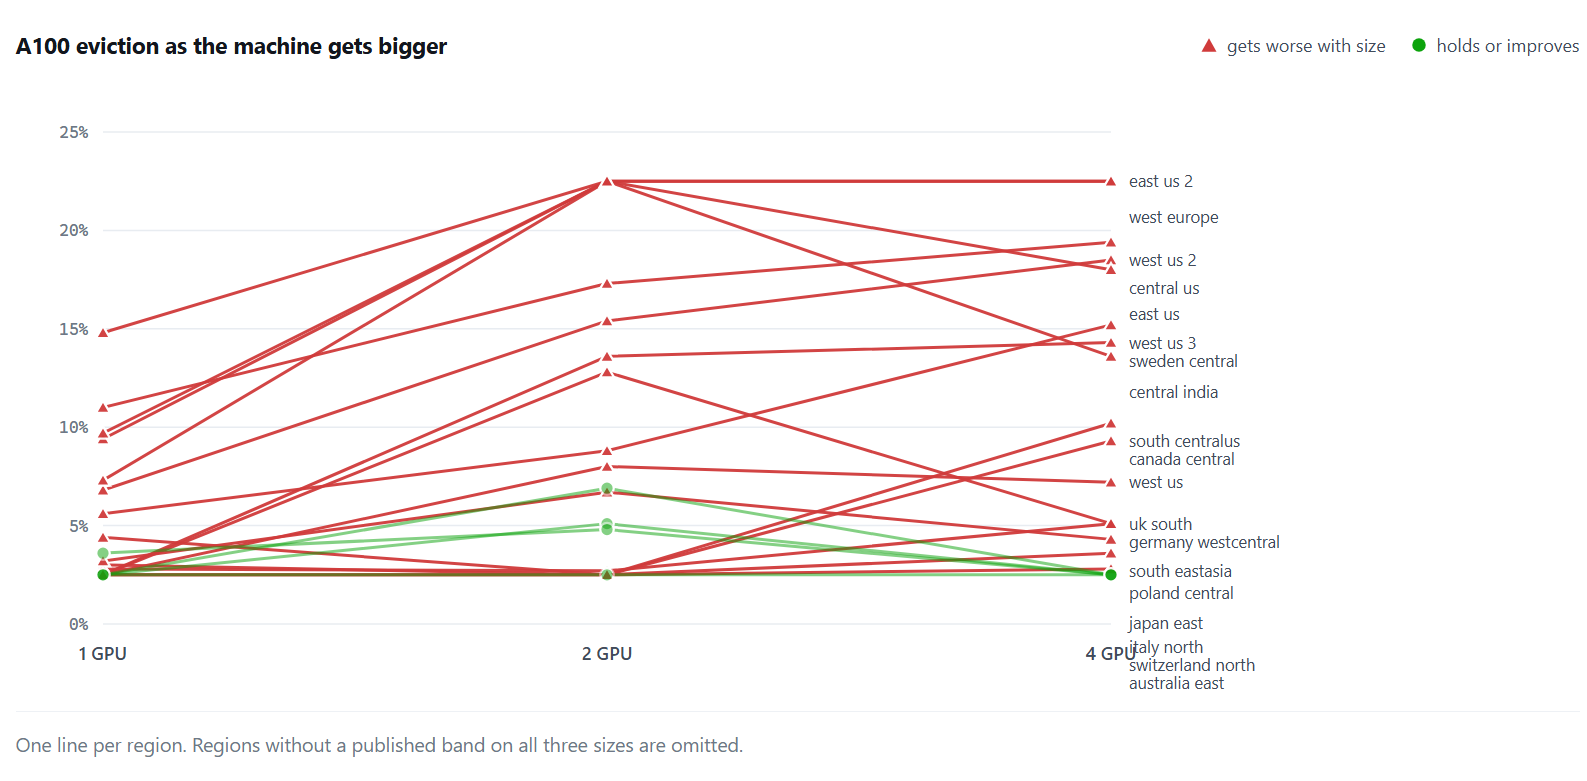
So the sizing rule is silicon-specific. On H100, going bigger still buys stability at the same per-GPU price. On A100, the small box is the calm one. If you'd sized an A100 fleet by the H100 rule, July's data says you had it backwards, and this is a finding you can only make by keeping the history.
4. The 10% club dissolved
June's report named four regions parked at exactly a 10.0% discount off pay-as-you-go: West US, West US 2, East US 2 and West Europe. All four moved on 1 July. Three went to 28.0%, and West US went to 17.8%. Whatever held them at 10.0% ended with the same 1 July stroke that repriced the rest of the fleet.
What to do with this if you run GPUs on Azure
- Check prices on the first of the month. That's when the list is rewritten. Mid-month checking buys you nothing: zero mid-month moves in 250 tracked combinations.
- Don't assume cheap means risky, or dear means safe. East US is currently both cheapest and lowest-band. The correlation you'd guess isn't in the data.
- Size A100s and H100s by different rules. The multi-GPU eviction advantage is real on H100 and inverted on A100, region by region.
- Verify at deploy time. Bands are Azure's published statements and prices reset monthly. Read the portal for your region and SKU before committing a workload.
Appendix: the July H100 table
Single-GPU H100 (NC40ads), Linux, all 22 deployable regions. June and July prices are each month's modal value; eviction is the mean band midpoint over 31 July snapshots.
| Region | June $/hr | July $/hr | Change | Discount | Eviction (mean) |
|---|---|---|---|---|---|
| east us | 1.7541 | 1.4030 | -20.0% | 79.9% | ~2.5% |
| indonesia central | 1.6105 | 1.5093 | -6.3% | 81.5% | ~13.8% |
| malaysia west | 1.5093 | 1.5093 | 0.0% | 81.5% | ~2.5% |
| north europe | 1.5479 | 1.5479 | 0.0% | 81.5% | ~5.1% |
| germany westcentral | 2.3937 | 1.9146 | -20.0% | 78.9% | ~2.5% |
| uk south | 2.5730 | 2.0582 | -20.0% | 76.4% | ~5.7% |
| canada central | 1.9207 | 2.1131 | +10.0% | 75.4% | ~19.9% |
| central us | 1.9522 | 2.1471 | +10.0% | 75.0% | ~22.5% |
| south eastasia | 2.8483 | 2.2785 | -20.0% | 74.9% | ~5.4% |
| australia east | 3.4027 | 2.7225 | -20.0% | 73.1% | ~7.5% |
| spain central | 3.4971 | 2.7975 | -20.0% | 69.2% | ~4.9% |
| sweden central | 4.1813 | 3.3447 | -20.0% | 63.1% | ~2.5% |
| korea central | 4.1866 | 3.3489 | -20.0% | 64.5% | ~7.0% |
| switzerland north | 4.2329 | 3.3866 | -20.0% | 66.1% | ~8.6% |
| south centralus | 5.2233 | 4.1783 | -20.0% | 50.1% | ~7.5% |
| central india | 5.6287 | 4.5029 | -20.0% | 53.9% | ~22.5% |
| japan east | 5.8297 | 4.6638 | -20.0% | 53.9% | ~6.2% |
| west us 3 | 4.2808 | 4.7087 | +10.0% | 32.5% | ~15.4% |
| east us 2 | 6.2820 | 5.0256 | -20.0% | 28.0% | ~13.3% |
| west us 2 | 6.2820 | 5.0256 | -20.0% | 28.0% | ~12.5% |
| west europe | 8.1720 | 6.5376 | -20.0% | 28.0% | ~13.3% |
| west us | 8.1666 | 7.4543 | -8.7% | 17.8% | ~7.5% |
The A100 tables and every other SKU we track live on the spot pricing map.
Method
Prices come from the Azure Retail Prices API (Linux, Spot consumption meters), snapshotted daily. The July value shown is the month's modal price. July validated the flat-within-month assumption perfectly: 0 of 250 SKU/region/months showed more than one price, so mode, median and mean coincide. Discount is calculated against the same region's PAYG price from the same API. Eviction comes from Azure's published eviction-rate band via Resource Graph, aggregated over 31 daily July snapshots at band midpoints. Regions priced in the API but absent from the Resource SKUs list are excluded as non-deployable, the same phantom-region screen as June.
Why this is a monthly report
Azure rewrites this price list on the first of each month, so July's map is already ageing. That's the nature of the thing: the right place to deploy moves every month.
This is 5 of the ~1,500 SKUs we track daily. The full July tables and the live spot map cover every SKU and region we watch.
Want spot prices and recorded eviction history for any Azure SKU, no sign-up? Try the Caleta spot pricing tool. Optimising a bigger Azure GPU bill? Run a free Cost Review.