Azure H100 prices are coming down, not up: this is the cheapest we've seen since we started tracking. But the same H100 still costs $1.51/hour in one region and $8.17 in another. We snapshot spot prices and eviction bands daily across ~1,500 SKU-region combinations. Here is the June cut for the five VMs you'd actually run AI inference on, including the full tables.
If you run open-model inference on Azure, spot GPUs are the cheapest way to do it, at up to 82% off on-demand. But "cheapest" is a two-variable problem: the sticker price, and how often Azure takes the machine back. This report covers both, for June 2026, across the five NC-series SKUs that matter for inference: NC40ads and NC80adis (1x and 2x H100) and NC24/48/96ads (1x, 2x and 4x A100). 22-23 deployable regions per SKU, 26 daily snapshots, Linux pricing.
One honesty note before the findings: this monitoring is young. We started daily snapshots in late April 2026, so this is eleven weeks of visibility, and the eviction figures are Azure's own published estimates rather than our measured interruptions. Treat the report as a map from one instrument, not gospel. If your experience in a region differs from what the data shows, we genuinely want to hear it.
Four findings stood out. None of them were what we expected.
1. H100 prices are coming down, not up
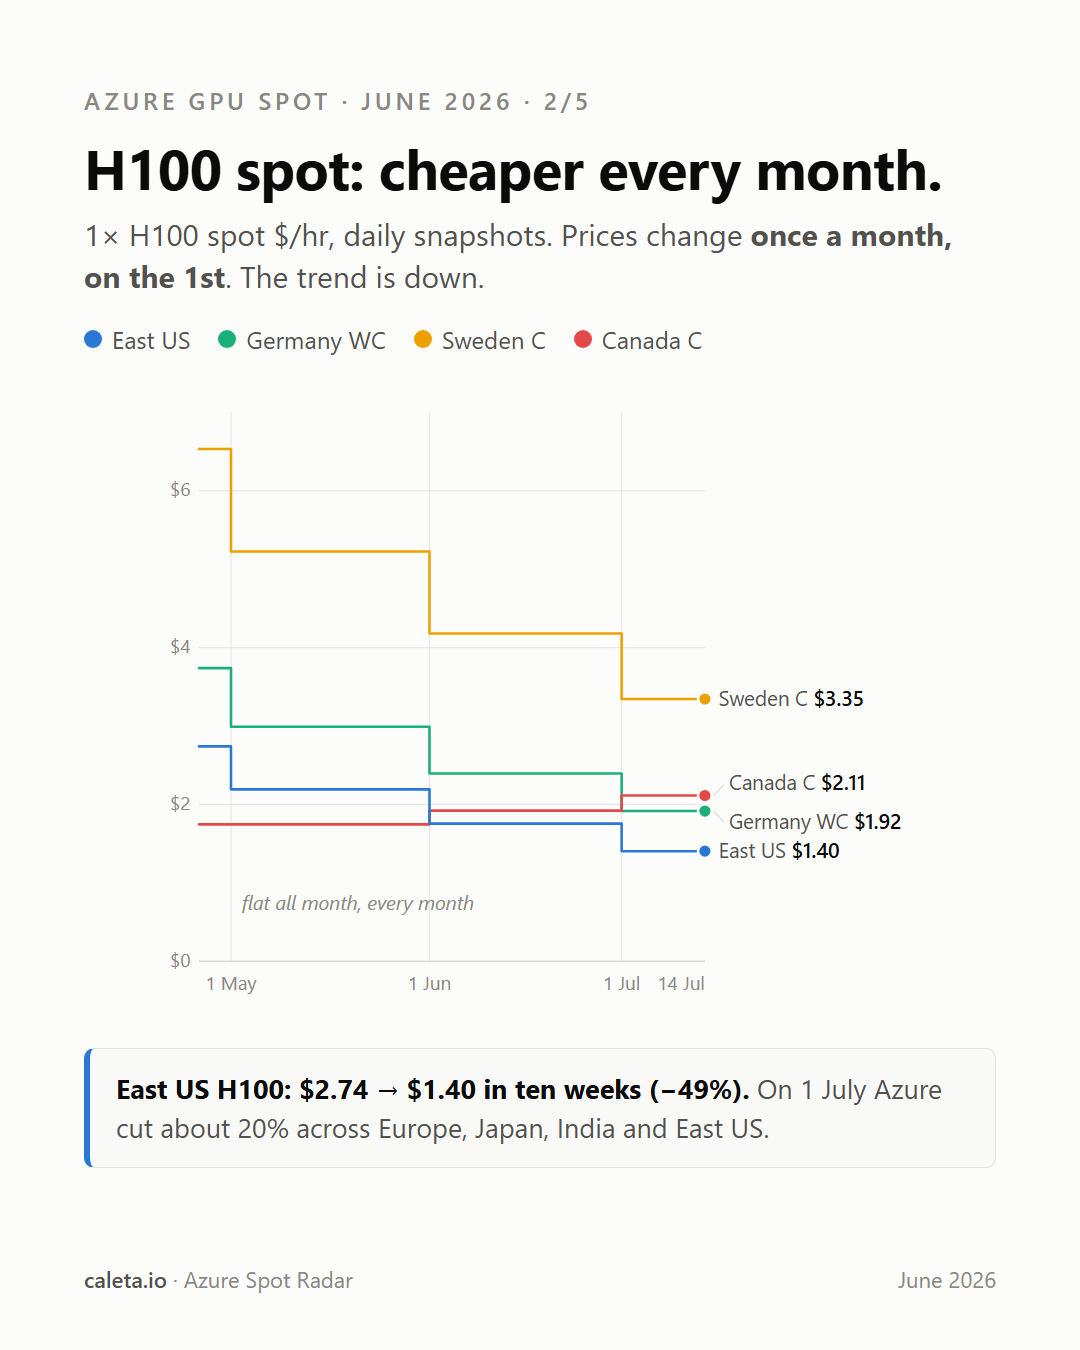
The headline first: this is the cheapest H100 hosting we've seen since we started tracking. H100 spot has stepped down month after month across most of the map this quarter. East US went $2.74 → $2.19 → $1.75 → $1.40, half price in ten weeks. Germany West Central and Sweden Central fell every month too. On 1 July Azure cut roughly 20% across most of Europe, Japan, India and East US.
The mechanics surprised us as much as the trend. Most people picture spot as a live, volatile market where prices move minute to minute. It isn't. Every meaningful price move in our data lands on the 1st of the month, in clean notches: a 20% cut here, a 10% rise there. Then the price sits completely flat until the next 1st. Within a month, timing buys you nothing; month to month, the trend has rewarded waiting. (Not universally: canadacentral rose two months running and westeurope rose in May. The trend is broad, not guaranteed.) The lever you control on any given day is where you deploy.
2. The same H100 spans 5.4x across regions, and the expensive end is a rip-off
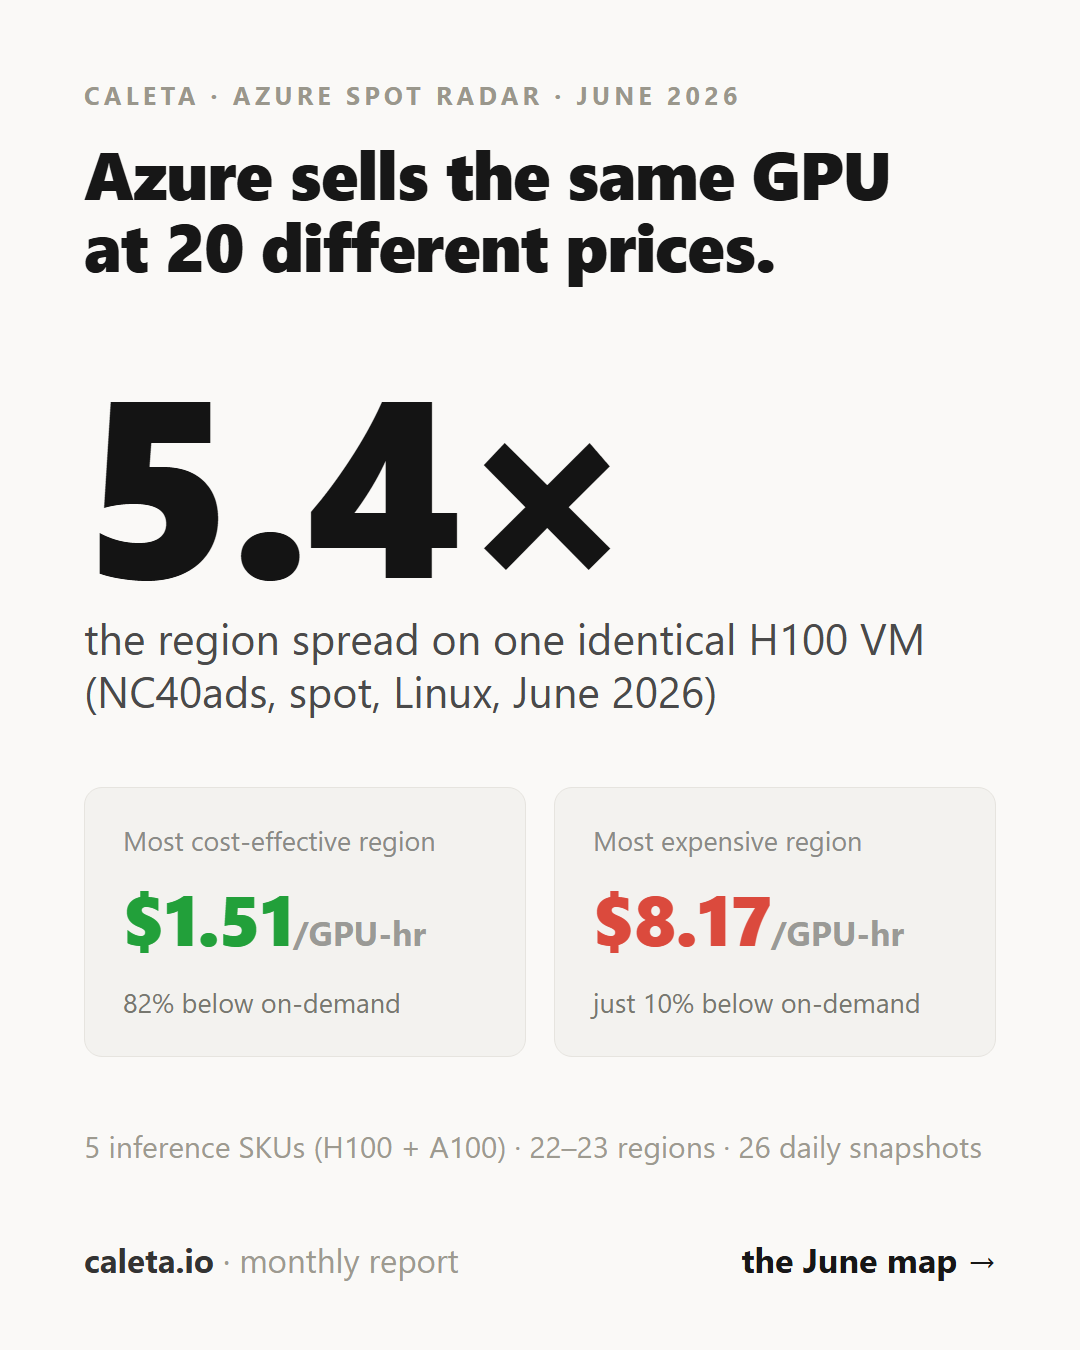
One identical single-H100 VM ranged from $1.51/GPU-hour to $8.17/GPU-hour in June. Same silicon, 5.4x the price.
The discounts come in what looks like a fixed menu, not a continuum. At the good end, a large group of regions all price H100 spot at exactly 81.5% below on-demand. Then the menu steps down through ~74%, ~66%, ~55%, ~42%, ~38%. And at the bottom sit four regions (westus, westus2, eastus2, westeurope) we've started calling the "10% club": spot priced at exactly 10.0% below on-demand. In three of the four you carry heavy eviction risk on top of the nearly-full price. Which tier your region sits in is not knowable from the price page alone; you have to compare against the same region's PAYG rate, which itself varies by region.
3. Cheap regions are not calm regions
This is the trap. Some of the cheap H100 regions were among the least stable:
- canadacentral sold H100 at ~$1.92/hr while sitting in Azure's 20%+ eviction band in every snapshot we took (a 25.0 mean never leaves that band). centralus rode alongside it at ~$1.95/hr and a 24.7% mean, a hair lower, so it dipped below 20%+ on at least one day.
- eastus sat in the 15%+ band in 24 of our 26 snapshots at $1.75 (16.9% mean).
- Meanwhile the actual floor stayed calm: malaysiawest at $1.51 and northeurope at $1.55 barely evicted, and a shelf of mid-priced regions (uksouth, germanywestcentral, southeastasia) sat quiet in the 0-5% band.
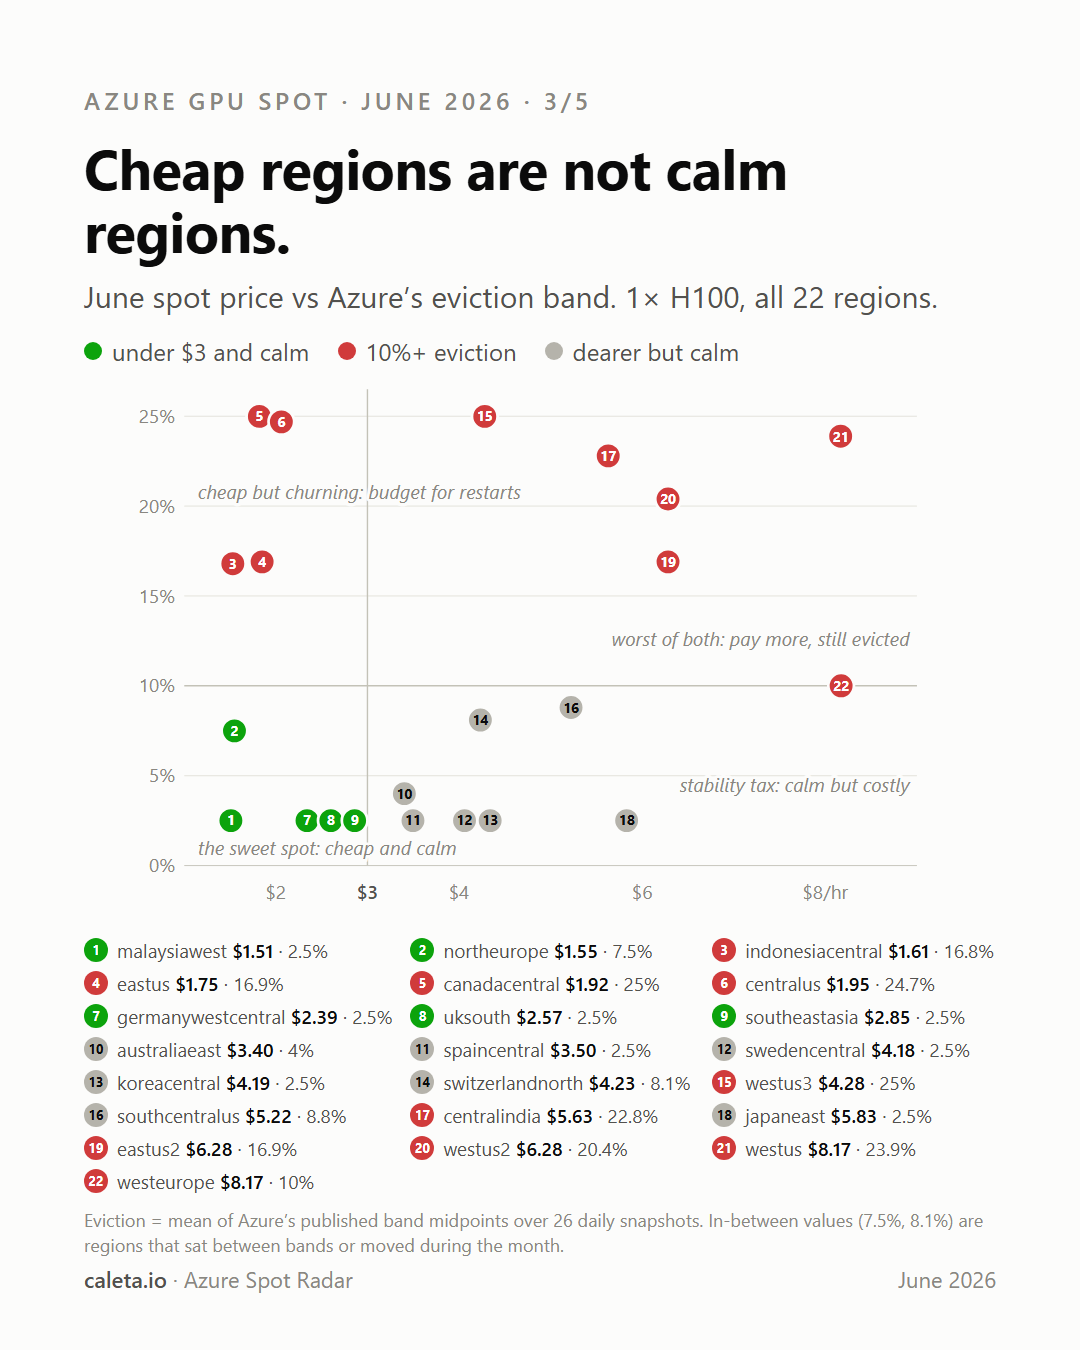
Inference tolerates spot better than almost any workload: it's stateless, so a killed box restarts and picks up where it left off in minutes. But there's still a floor below which the interruptions cost more than the discount saves. A cheap region that evicts you daily is more expensive than a calm one that costs a few cents more.
4. The bigger box gets evicted less, at the same per-GPU price
The most practically useful finding in the data. Azure prices NC40ads (1x H100) and NC80adis (2x H100) at exactly the same per-GPU rate in every region: the 2x box is precisely double the 1x. But it is not double the trouble. In the same region, the 2x VM was evicted far less than the 1x:
| Region | 1x H100 eviction | 2x H100 eviction |
|---|---|---|
| Central India | 22.8% | 5.4% |
| Canada Central | 25.0% | 9.0% |
| West US | 23.9% | 9.0% |
| Indonesia Central | 16.8% | 2.5% |
| Central US | 24.7% | 13.8% |
| East US | 16.9% | 9.2% |
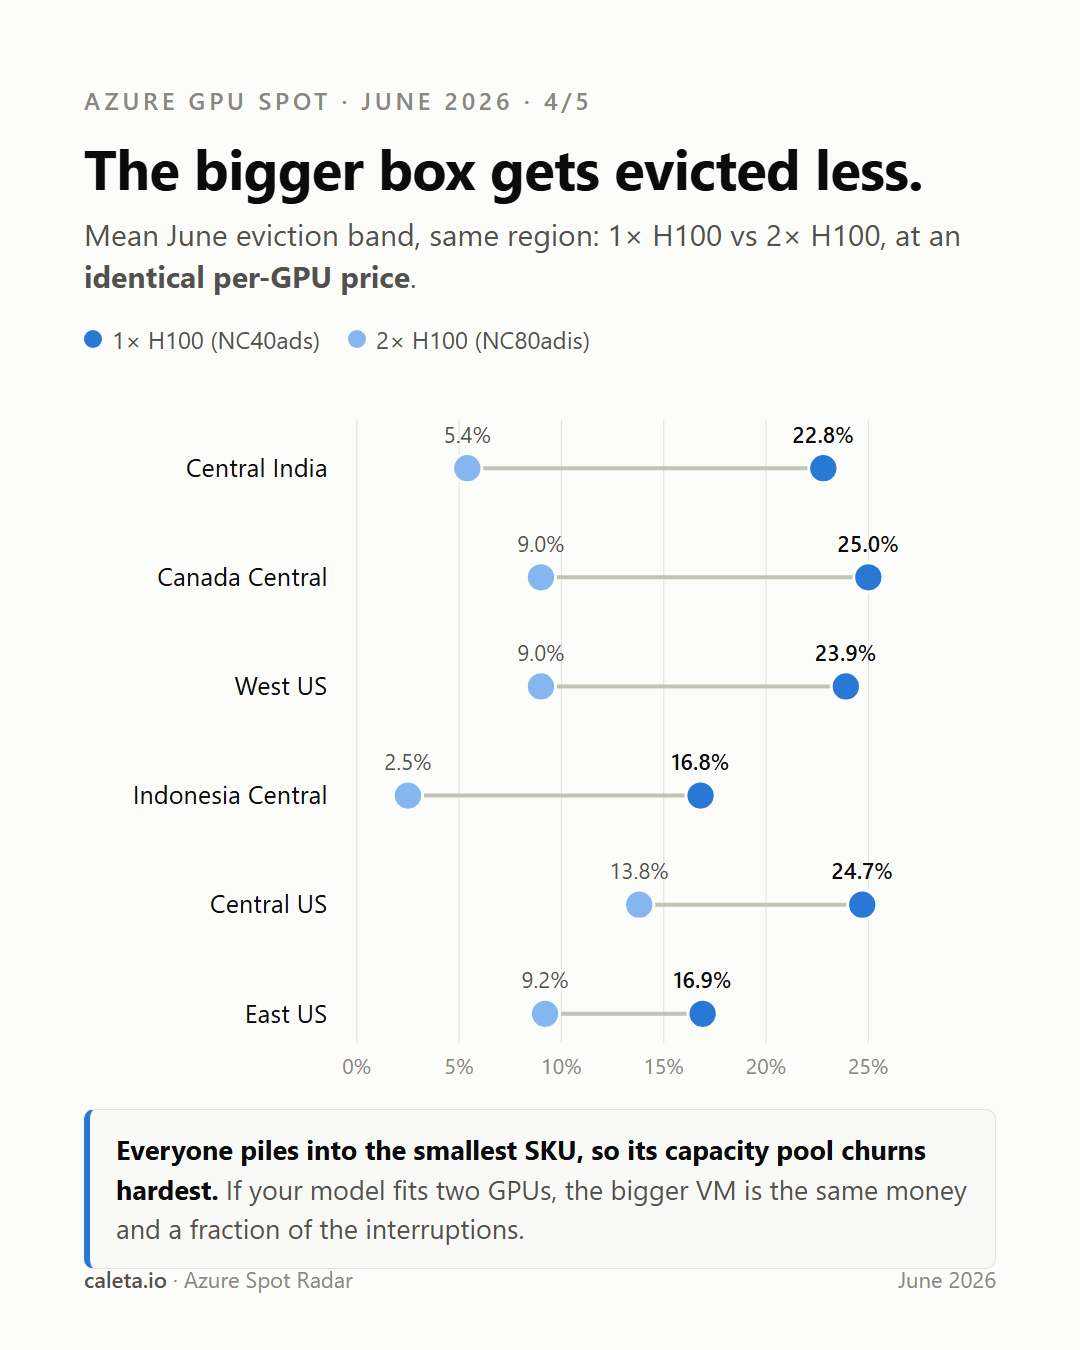
Our working hypothesis: everyone piles into the smallest SKU, so that capacity pool churns hardest. If your model fits across two GPUs, the bigger VM is the same money and a fraction of the interruptions. The same pattern shows in the A100 family in several regions, though less dramatically.
The quiet bargain: A100s
While the H100 map is a minefield, the A100 SKUs were cheap and calm almost everywhere: a $0.82/GPU-hour floor, ~81.5% off on-demand, mostly in the 0-5% eviction band, and the per-GPU price holds nearly flat across the 1x, 2x and 4x sizes. The traps are few but real. eastus2 sat in the 20%+ band effectively all month on the larger sizes (25.0 mean on both the 2x and 4x), with westeurope just behind (24.1-24.4). And swedencentral charged 2.8x the floor ($2.29/GPU-hr vs $0.82 on the 1x A100) while its 4x box still churned at a 17.6% mean, the worst combination of price and instability on the A100 map. But broadly: if A100-class throughput covers your workload (and for most open-weights inference it does), it's the low-drama choice at a fraction of the H100's price.
Honest nulls, caveats, and data hygiene
- This dataset is young. Daily snapshots began late April 2026. Eleven weeks is enough to see the monthly repricing pattern three times, but not enough to call anything a law. We'll be wrong about something above; the monthly cadence exists partly to find out what.
- Eviction figures are Azure's own published eviction-rate bands (0-5 / 5-10 / 10-15 / 15-20 / 20+ %, via Resource Graph), averaged over 26 daily snapshots at band midpoints. That's why you see values like 7.5% or 8.1%: they are means of band midpoints, not raw measurements. They are Azure's estimates, not our counted interruptions.
- Phantom regions exist. northcentralus, koreasouth and uaenorth carry Retail-API prices for the H100 SKUs but are absent from the Resource SKUs region list and never report an eviction band: priced, but not deployable. We exclude them. The two newest regions on the map (malaysiawest, indonesiacentral) have been manually verified as real and deployable.
- No weekday pattern, no global "crunch day." Eviction pressure is region-local, and H100 pressure actually eased through June (10 regions in the high band down to 6).
- Allocation success is not covered. "Can you even get one" is a third variable we don't yet capture historically. It's on the roadmap.
The cheat sheet
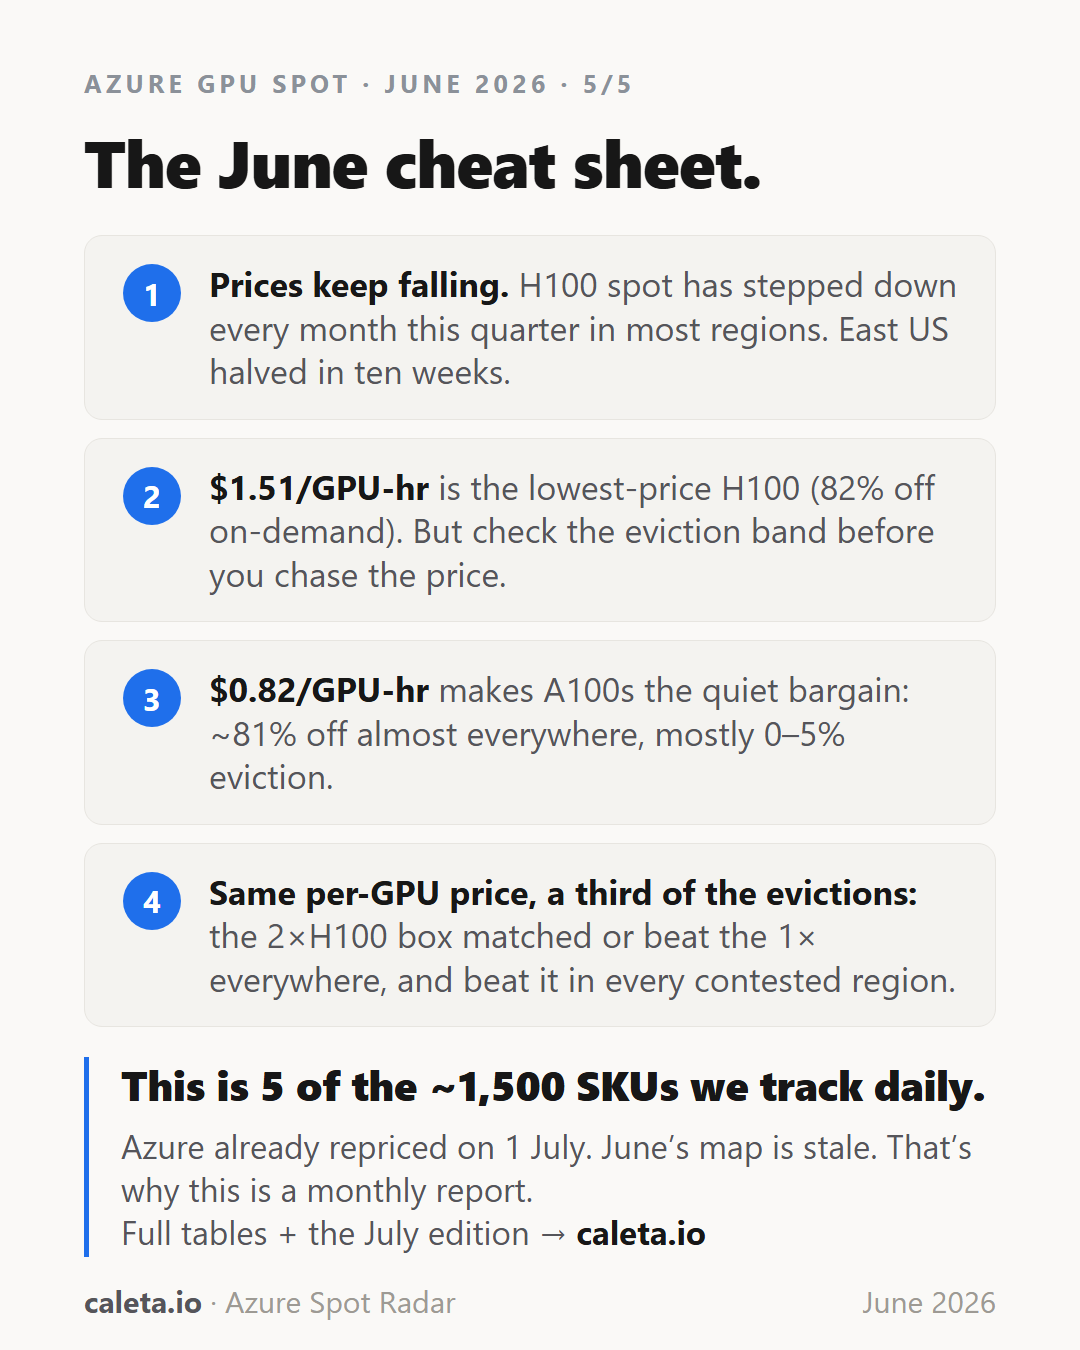
- Prices keep falling. H100 spot has stepped down every month this quarter in most regions. East US halved in ten weeks.
- $1.51/GPU-hr is the lowest-price H100, at 82% off. Check the eviction band before chasing the price.
- $0.82/GPU-hr makes A100s the quiet bargain: ~81% off, mostly 0-5% eviction.
- Go bigger for stability. At the same per-GPU price, the 2xH100 box matched or beat the 1x everywhere, and beat it in every contested region.
Appendix: the full June tables
Monthly aggregates per SKU, Linux, sorted by spot price. "Eviction" is the mean band midpoint over 26 June snapshots; "worst" is the worst band observed that month.
NC40ads (1x H100 NVL, 40 vCPU)
| Region | Spot $/hr | PAYG $/hr | Discount | Eviction (mean) | Worst band |
|---|---|---|---|---|---|
| malaysiawest | 1.51 | 8.17 | 81.5% | 2.5% | 0-5 |
| northeurope | 1.55 | 8.38 | 81.5% | 7.5% | 5-10 |
| indonesiacentral | 1.61 | 8.17 | 80.3% | 16.8% | 20+ |
| eastus | 1.75 | 6.98 | 74.9% | 16.9% | 15-20 |
| canadacentral | 1.92 | 8.59 | 77.6% | 25.0% | 20+ |
| centralus | 1.95 | 8.59 | 77.3% | 24.7% | 20+ |
| germanywestcentral | 2.39 | 9.07 | 73.6% | 2.5% | 0-5 |
| uksouth | 2.57 | 8.72 | 70.5% | 2.5% | 0-5 |
| southeastasia | 2.85 | 9.07 | 68.6% | 2.5% | 0-5 |
| australiaeast | 3.40 | 10.12 | 66.4% | 4.0% | 5-10 |
| spaincentral | 3.50 | 9.07 | 61.5% | 2.5% | 0-5 |
| swedencentral | 4.18 | 9.07 | 53.9% | 2.5% | 0-5 |
| koreacentral | 4.19 | 9.42 | 55.6% | 2.5% | 0-5 |
| switzerlandnorth | 4.23 | 9.98 | 57.6% | 8.1% | 10-15 |
| westus3 | 4.28 | 6.98 | 38.7% | 25.0% | 20+ |
| southcentralus | 5.22 | 8.38 | 37.7% | 8.8% | 10-15 |
| centralindia | 5.63 | 9.77 | 42.4% | 22.8% | 20+ |
| japaneast | 5.83 | 10.12 | 42.4% | 2.5% | 0-5 |
| eastus2 | 6.28 | 6.98 | 10.0% | 16.9% | 20+ |
| westus2 | 6.28 | 6.98 | 10.0% | 20.4% | 20+ |
| westus | 8.17 | 9.07 | 10.0% | 23.9% | 20+ |
| westeurope | 8.17 | 9.08 | 10.0% | 10.0% | 15-20 |
NC80adis (2x H100 NVL, 80 vCPU)
| Region | Spot $/hr | $/GPU-hr | Discount | Eviction (mean) | Worst band |
|---|---|---|---|---|---|
| malaysiawest | 3.02 | 1.51 | 81.5% | 2.5% | 0-5 |
| northeurope | 3.10 | 1.55 | 81.5% | 3.3% | 5-10 |
| indonesiacentral | 3.22 | 1.61 | 80.3% | 2.5% | 0-5 |
| eastus | 3.51 | 1.75 | 74.9% | 9.2% | 10-15 |
| canadacentral | 3.84 | 1.92 | 77.6% | 9.0% | 10-15 |
| centralus | 3.90 | 1.95 | 77.3% | 13.8% | 15-20 |
| germanywestcentral | 4.79 | 2.39 | 73.6% | 2.5% | 0-5 |
| uksouth | 5.15 | 2.57 | 70.5% | 2.5% | 0-5 |
| southeastasia | 5.70 | 2.85 | 68.6% | 2.5% | 0-5 |
| australiaeast | 6.81 | 3.40 | 66.4% | 2.5% | 0-5 |
| spaincentral | 6.99 | 3.50 | 61.5% | 2.5% | 0-5 |
| swedencentral | 8.36 | 4.18 | 53.9% | 2.5% | 0-5 |
| koreacentral | 8.37 | 4.19 | 55.6% | 2.5% | 0-5 |
| switzerlandnorth | 8.47 | 4.23 | 57.6% | 2.5% | 0-5 |
| westus3 | 8.56 | 4.28 | 38.7% | 17.6% | 20+ |
| southcentralus | 10.45 | 5.22 | 37.7% | 4.8% | 5-10 |
| centralindia | 11.26 | 5.63 | 42.4% | 5.4% | 15-20 |
| japaneast | 11.66 | 5.83 | 42.4% | 2.5% | 0-5 |
| eastus2 | 12.56 | 6.28 | 10.0% | 9.4% | 10-15 |
| westus2 | 12.56 | 6.28 | 10.0% | 13.5% | 20+ |
| westus | 16.33 | 8.17 | 10.0% | 9.0% | 10-15 |
| westeurope | 16.34 | 8.17 | 10.0% | 2.5% | 0-5 |
NC24ads (1x A100 80GB, 24 vCPU)
| Region | Spot $/hr | PAYG $/hr | Discount | Eviction (mean) | Worst band |
|---|---|---|---|---|---|
| northeurope | 0.82 | 4.41 | 81.5% | 11.0% | 10-15 |
| southcentralus | 0.82 | 4.41 | 81.5% | 2.5% | 0-5 |
| eastus | 0.82 | 3.67 | 77.6% | 5.0% | 5-10 |
| centralus | 0.84 | 4.15 | 79.7% | 2.5% | 0-5 |
| francecentral | 0.85 | 4.59 | 81.5% | 2.5% | 0-5 |
| germanywestcentral | 0.88 | 4.78 | 81.5% | 2.5% | 0-5 |
| italynorth | 0.88 | 4.78 | 81.5% | 2.5% | 0-5 |
| polandcentral | 0.88 | 4.78 | 81.5% | 4.8% | 5-10 |
| southeastasia | 0.88 | 4.78 | 81.5% | 2.5% | 0-5 |
| westus | 0.88 | 4.78 | 81.5% | 2.5% | 0-5 |
| koreacentral | 0.92 | 4.96 | 81.5% | 2.5% | 0-5 |
| uksouth | 0.94 | 4.59 | 79.6% | 2.5% | 0-5 |
| eastus2 | 0.95 | 3.67 | 74.2% | 7.5% | 5-10 |
| centralindia | 0.95 | 5.14 | 81.5% | 6.0% | 5-10 |
| switzerlandnorth | 0.97 | 5.25 | 81.5% | 2.5% | 0-5 |
| australiaeast | 0.98 | 5.33 | 81.5% | 2.5% | 0-5 |
| japaneast | 0.98 | 5.33 | 81.5% | 2.5% | 0-5 |
| westus2 | 1.04 | 3.67 | 71.7% | 2.5% | 0-5 |
| canadacentral | 1.08 | 4.41 | 75.4% | 2.5% | 0-5 |
| westus3 | 1.14 | 3.67 | 69.0% | 3.1% | 5-10 |
| brazilsouth | 1.36 | 7.35 | 81.5% | 2.5% | 0-5 |
| westeurope | 1.71 | 4.78 | 64.1% | 6.2% | 5-10 |
| swedencentral | 2.29 | 4.78 | 52.1% | 6.0% | 5-10 |
NC48ads (2x A100 80GB, 48 vCPU)
| Region | Spot $/hr | $/GPU-hr | Discount | Eviction (mean) | Worst band |
|---|---|---|---|---|---|
| northeurope | 1.63 | 0.82 | 81.5% | n/a | n/a |
| southcentralus | 1.63 | 0.82 | 81.5% | n/a | n/a |
| eastus | 1.64 | 0.82 | 77.6% | 11.7% | 10-15 |
| centralus | 1.69 | 0.84 | 79.7% | 2.5% | 0-5 |
| francecentral | 1.70 | 0.85 | 81.5% | 2.5% | 0-5 |
| germanywestcentral | 1.77 | 0.88 | 81.5% | 2.5% | 0-5 |
| italynorth | 1.77 | 0.88 | 81.5% | 8.8% | 10-15 |
| polandcentral | 1.77 | 0.88 | 81.5% | 2.5% | 0-5 |
| southeastasia | 1.77 | 0.88 | 81.5% | 2.7% | 5-10 |
| westus | 1.77 | 0.88 | 81.5% | 8.1% | 10-15 |
| koreacentral | 1.83 | 0.92 | 81.5% | n/a | n/a |
| uksouth | 1.87 | 0.94 | 79.6% | 2.7% | 5-10 |
| eastus2 | 1.90 | 0.95 | 74.2% | 25.0% | 20+ |
| centralindia | 1.90 | 0.95 | 81.5% | 10.8% | 20+ |
| switzerlandnorth | 1.94 | 0.97 | 81.5% | 2.5% | 0-5 |
| australiaeast | 1.97 | 0.98 | 81.5% | 2.5% | 0-5 |
| japaneast | 1.97 | 0.98 | 81.5% | 3.3% | 5-10 |
| westus2 | 2.08 | 1.04 | 71.7% | 12.9% | 15-20 |
| canadacentral | 2.17 | 1.08 | 75.4% | 2.5% | 0-5 |
| westus3 | 2.28 | 1.14 | 69.0% | 11.9% | 10-15 |
| brazilsouth | 2.72 | 1.36 | 81.5% | 3.1% | 5-10 |
| westeurope | 3.43 | 1.71 | 64.1% | 24.1% | 20+ |
| swedencentral | 4.58 | 2.29 | 52.1% | 2.5% | 0-5 |
NC96ads (4x A100 80GB, 96 vCPU)
| Region | Spot $/hr | $/GPU-hr | Discount | Eviction (mean) |
|---|---|---|---|---|
| northeurope | 3.26 | 0.82 | 81.5% | 8.5% |
| southcentralus | 3.26 | 0.82 | 81.5% | 6.5% |
| eastus | 3.29 | 0.82 | 77.6% | 8.8% |
| centralus | 3.38 | 0.84 | 79.7% | 11.7% |
| francecentral | 3.39 | 0.85 | 81.5% | 2.5% |
| germanywestcentral | 3.53 | 0.88 | 81.5% | 2.5% |
| italynorth | 3.53 | 0.88 | 81.5% | 2.5% |
| polandcentral | 3.53 | 0.88 | 81.5% | 2.7% |
| southeastasia | 3.53 | 0.88 | 81.5% | 7.9% |
| westus | 3.53 | 0.88 | 81.5% | 2.5% |
| koreacentral | 3.67 | 0.92 | 81.5% | 2.5% |
| uksouth | 3.75 | 0.94 | 79.6% | 2.5% |
| eastus2 | 3.80 | 0.95 | 74.2% | 25.0% |
| centralindia | 3.80 | 0.95 | 81.5% | 11.2% |
| switzerlandnorth | 3.88 | 0.97 | 81.5% | 2.5% |
| australiaeast | 3.94 | 0.98 | 81.5% | 2.5% |
| japaneast | 3.94 | 0.98 | 81.5% | 3.3% |
| westus2 | 4.16 | 1.04 | 71.7% | 9.4% |
| canadacentral | 4.34 | 1.08 | 75.4% | 9.2% |
| westus3 | 4.55 | 1.14 | 69.0% | 17.3% |
| brazilsouth | 5.43 | 1.36 | 81.5% | 2.5% |
| westeurope | 6.86 | 1.71 | 64.1% | 24.4% |
| swedencentral | 9.15 | 2.29 | 52.1% | 17.6% |
Method
Prices come from the Azure Retail Prices API (Linux, Spot consumption meters),
snapshotted daily since late April. The June value shown is the month's modal price;
prices were flat within June for all five SKUs, so mode, median and mean coincide.
Discount is calculated against the same region's PAYG price from the same API. Eviction
comes from Azure's published eviction-rate band via Resource Graph, aggregated over 26
daily June snapshots at band midpoints (1, 7, 9 and 14 June were missed). Some SKU-region
pairs never report a band at all (shown n/a in the tables): they are priced and
deployable, but Azure publishes no eviction estimate for them. Regions priced in the API
but absent from the Resource SKUs list are excluded entirely as non-deployable.
Why this is a monthly report
On 1 July, Azure repriced again, so June's map is already stale. That's the nature of the thing: the right place to deploy moves every month.
This is 5 of the ~1,500 SKUs we track daily. The full June tables and the live spot map cover every SKU and region we watch, and the July repricing lands there the moment it does.
Want spot prices and recorded eviction history for any Azure SKU, no sign-up? Try the Caleta spot pricing tool. Optimising a bigger Azure GPU bill? Run a free Cost Review.