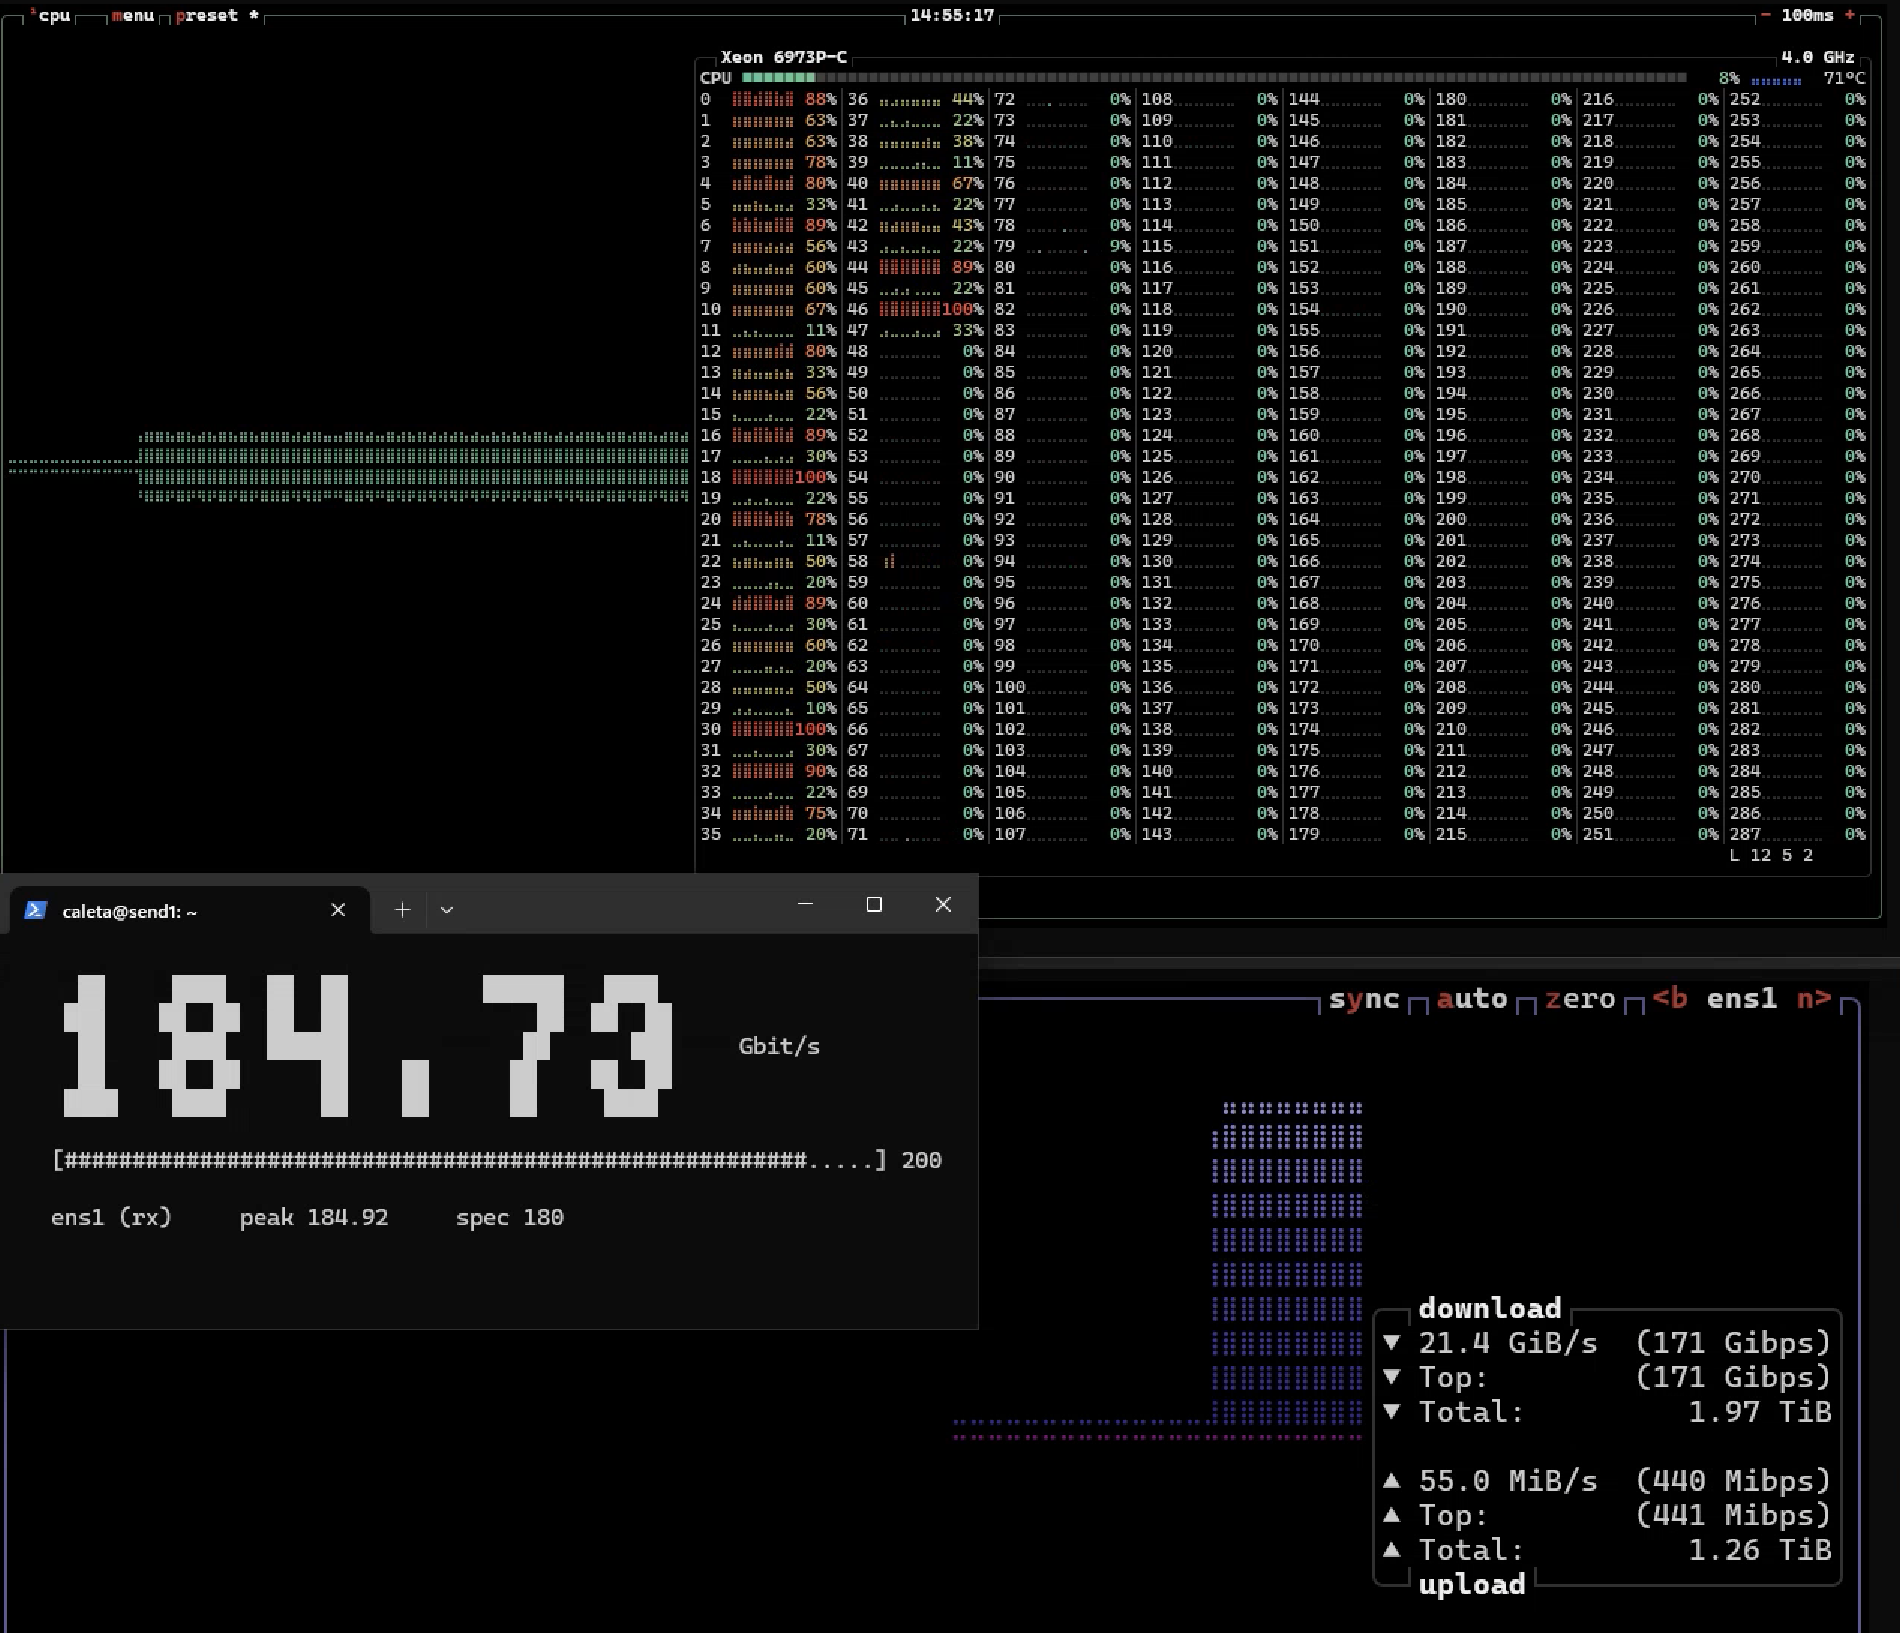
Azure's new RTX PRO 6000 Blackwell VMs moved 184 Gbit/s between two of them, on a NIC whose spec sheet says 180.
For context on why that is unusual: almost every Azure VM size tops out at 40 or 80 Gbit/s on the NIC. This is one of a handful that clears 100, and it beat its own rating doing it.
This article is the receipts: the tool, the method, the five readings, the volume of data moved, and the one routing decision that quietly costs you half your bandwidth if you get it wrong.
The box
Standard_NC288ds_xl_RTXPRO6000BSE_v6, West US 2, spot:
- 288 vCPUs, Xeon 6973P-C
- 1,015 GB RAM
- 2 x RTX PRO 6000 Blackwell, 192 GB VRAM total
- MANA NIC, rated 180 Gbit/s
NVIDIA's own store currently lists the workstation RTX PRO 6000 at $16,000, up from $8,565 at launch; the Server Edition in this VM ships through OEM channels without a public list price. This VM carries two of them, and it rented for roughly $2.31/hr on spot in West US 2. Spot pricing moves: our 14 August session on the same SKU and region recorded $2.543/hr, so treat the exact figure as a snapshot and check the meter for yourself.
Live today in West US 2 and Southeast Asia, with eight more regions expected in Q3 including East US, West Europe and North Europe.
Tool and method, before any numbers
Two of these VMs, plain Ubuntu 24.04, spot, one sending and one receiving, sitting in two different subscriptions, across peered VNets in the same availability zone. The cross-subscription split was forced by quota rather than chosen, and it turned out to cost nothing: peering inside a single tenant carried full line rate.
The tool is ntttcp-for-linux, Microsoft's own, which is what Azure's documented bandwidth
testing procedure specifies. 64 threads, 60 second runs.
Ground truth is the MANA VF kernel byte counter, read as a delta over wall clock, not the tool's own report. That distinction matters and is covered below.
This box presents two interfaces carrying the same traffic: eth0, the hv_netvsc synthetic
device, and the MANA VF. They report the same bytes (lifetime ratio 0.986 receive, 0.957
transmit), so any tool that sums both doubles every figure you publish. We verified that
mirror explicitly before trusting a single reading.
One naming warning. Older documentation and some of our own scripts hardcode enP30832s1. On
these deployments the VF came up as ens1. Detect by driver (mana), never by name: a
hardcoded interface inside a || true fails silently, and you measure nothing while believing
you measured zero.
ethtool reports Speed: Unknown! on MANA, so the 180 rating is not even readable from
inside the guest. You cannot check the spec from the box. You can only measure it.
The readings
| path | receiver ingress | sender egress | ntttcp | retrans | % of 180 spec |
|---|---|---|---|---|---|
| public IPs, 2 subs, no peering (64 thr) | 95.79 | 95.75 | 91.56 | 214,462 | 53% |
| public IPs (128 thr) | 95.78 | 95.84 | 91.57 | 693,639 | 53% |
| private, VNET-peered | 184.31 | 184.15 | 176.00 | 60,411 | 102% |
| private, reverse direction | 184.36 | 184.24 | 176.04 | 24,440 | 102% |
| private, filmed retake | 184.27 | n/a | 175.95 | 0 | 102% |
Five ground-truth readings span 184.15 to 184.36, in both directions, including one clean retake with zero retransmits. The figure also ties to a blob upload peak of 183.0 measured the previous day by a completely different method, against object storage rather than another VM. Two independent roads to the same ceiling is what makes us willing to publish it.
Three numbers from one run, and why they differ
Alongside ntttcp we ran a live ticker, gbit.sh, which prints per-second decimal Gbit/s
straight off the same VF counter. Filmed during the peered run, it held a steady state of
184.73 Gbit/s on ens1 receive with a 184.92 peak, against the 180 spec printed
beside it. That is the capture at the top of this article.
Those are not in conflict with the 184.27 in the table above. They are the same counter over three different windows:
| figure | window | value |
|---|---|---|
| Peak | single 1 second sample | 184.92 |
| Steady state | the plateau, once ramped | 184.73 |
| Whole run | 60 second delta, ramp and tail included | 184.27 |
The whole-run number is necessarily the lowest of the three, because it divides by a window that contains the ramp up and the tail. Anyone quoting a benchmark should say which of these three they mean. We use the whole-run figure for anything load bearing, and the peak only where it is labelled as a peak.
How much data that actually is
The session recorded rates and durations rather than a byte total, so this is derived arithmetic rather than an inventoried count. Over a 60 second run:
| rate | volume in 60 s | |
|---|---|---|
| Wire (VF counter) | 184.27 Gbit/s | 1.38 TB |
| Application (ntttcp) | 175.95 Gbit/s | 1.32 TB |
Why you will see two different numbers, and both are right
This trips people up, so it is worth being precise.
- 184.27 Gbit/s is the wire figure. Every byte that crossed the NIC, from the kernel counter.
- 175.95 Gbit/s is the application figure. What ntttcp actually delivered into userspace.
The gap is 4.5%, and that is not an error bar. It is TCP/IP and Ethernet framing overhead at a 1500 byte MTU: headers, frame check sequence, preamble, interframe gap. If those two numbers had matched exactly, one of them would be wrong.
Quote the wire figure when you are talking about what the hardware can do. Quote the application figure when you are talking about what your software will feel. If you run ntttcp yourself on this SKU, 176 is the number you should expect to see on screen, not 184.
There is a third number in the screenshot above, and it is the same measurement again in different units. btop reports the download at 21.4 GiB/s, which it labels 171 Gibps. btop displays Gibps, binary, not Gbit/s. 171 Gibps is 183.8 Gbit/s decimal, one sample away from the ticker's 184.73. It corroborates the reading rather than contradicting it.
This unit trap is worth internalising, because it works in the direction that flatters you. A tool showing a smaller binary number can be reporting a larger decimal one. Every figure in this article is decimal Gbit/s.
A caution on the totals in that same btop panel, 1.97 TiB down and 1.26 TiB up: those are lifetime interface counters and cannot be zeroed without bouncing the interface, so they cover the whole session across several runs, not the single run being filmed. That is exactly why we built a delta ticker to film against.
The part that stings: routing over public IPs costs you 48%
Look again at the top two rows of that table. Same two VMs, same NIC, same region, same tool. The only difference is the route.
Public IPs, no peering: 95.79 Gbit/s. Private and peered: 184.31 Gbit/s.
That is 53% of the rated card against 102% of it. If you move data between VMs on Azure over public addresses, you are leaving roughly half of your paid-for bandwidth on the floor, and nothing in the portal warns you.
What is happening is that with no peering, traffic between two VMs in the same region hairpins out through the load balancer edge and back. The latency says so before the throughput does:
- Public path: TCP RTT 2.163 ms p50 (min 1.961, p90 4.492)
- Peered path: ICMP 0.623 ms min, 1.238 ms average
- Same-rack Azure should be 50 to 150 microseconds
A 2 ms round trip inside one region is not a same-rack number. We had that on screen for a session and read it as noise.
The second tell was subtler and is the more useful lesson. Doubling ntttcp threads from 64 to 128 on the public path moved throughput by 0.01 Gbit/s while tripling retransmits from 214,462 to 693,639. If retransmits were causing the ceiling, more threads would have made throughput worse in proportion. Instead the number did not move at all. Retransmits were a symptom of something clamping the path, not the clamp itself.
That flatness is also why we are not going to tell you the public path is hitting a shared 100 Gbit backbone, tempting as the ~96 number makes it. Two readings 0.01 Gbit/s apart while retransmits triple is the signature of a deliberate rate limit, not of a fabric under contention, which would vary. We measured latency and throughput. We did not measure topology, and nobody outside Microsoft can see it.
Four deployment traps that nearly stopped the test
None of these are documented together anywhere, and all four cost us time.
Cross-subscription proximity placement groups do not work. Create a PPG in subscription A,
reference it by full resource ID from a VM create in subscription B, and you get
Proximity Placement Group 'x' does not exist. Not a permissions error, and the message does
not hint at the real cause.
Logical zone numbers mean different datacentres in different subscriptions. In our bench
subscription, zone 1 maps to az1, 2 to az3, 3 to az2. In the PAYG subscription, 1 maps to az3,
2 to az2, 3 to az1. Deploying both VMs as "zone 1" puts them in physically different
datacentres while the portal shows the same number on both. Query the real mapping with
az rest against .../locations?api-version=2022-12-01 and read availabilityZoneMappings.
This SKU is offered in exactly one logical zone per subscription. Both of ours resolved to
westus2-az2, which meant --zone 3 in one and --zone 2 in the other.
Peering needs distinct address spaces. az vm create defaults every VNET it creates to
10.0.0.0/16, and two VNETs with identical spaces cannot peer. We used 10.10.0.0/16 and
10.20.0.0/16. Cross-subscription peering itself works fine inside one tenant.
Quota shaped the test. Total Regional Low-priority vCPUs was 288 of 288 in both
subscriptions, exactly one of these VMs each. That is why the test ran one VM per subscription, which forced the cross-subscription setup, which produced the public-IP hairpin that cost us half our bandwidth in the first place.
Two smaller ones worth banking. NSG port ranges gate ntttcp thread count: ntttcp uses ports
5001 upward, so a rule covering 5000 to 5200 silently strangles a 256 thread run, and the
sender hangs in handshake with zero traffic and no error. And read retransmits from the
sender, because the ntttcp receiver cheerfully reports retrans segs 0 while the sender is
counting hundreds of thousands.
What this does not tell you
This is raw TCP between two VMs. It is the best case: no storage service in the path, no TLS, no object protocol, no per-account pacing.
Pulling the same volume of data out of Azure Blob behaves completely differently, tops out a long way below 184, and is limited by something else entirely. That is the next article.