No alert fires when a VM does nothing.
Every monitoring setup you've ever seen is pointed at the top of the graph. CPU over 80%, memory pressure, disk latency, failed health checks. The alerts, the dashboards, the on-call rotations, the SRE playbooks. All of it exists to catch VMs that are working too hard. Fair enough. That's where the outages come from.
But there's a whole other category of problem sitting at the bottom of the graph, and nobody is watching it. VMs that aren't working hard. VMs that aren't working at all. VMs that have been quietly drawing breath on someone's subscription for three years because the project that needed them got cancelled and nobody remembered to turn them off.
Those VMs don't page anyone. They don't break anything. They just sit there, costing money, month after month, doing a passable impression of being alive.
I've been staring at a lot of these lately, and I've started to notice shapes.
The shape of a dead VM
Over 7 days, this VM's CPU averaged 7.69%, with metronomic spikes to 60%. Your first instinct is probably right. It's doing nothing.
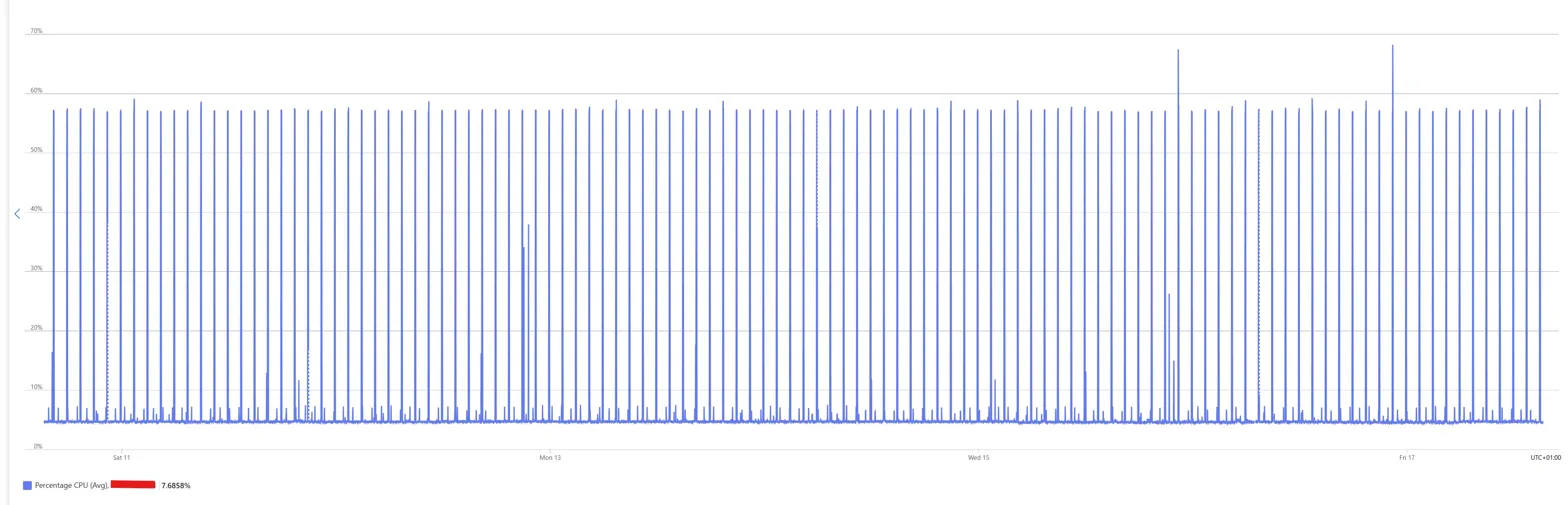
A note on the chart before going further: this is a small B-series VM with a periodic task burning accumulated CPU credits. The spikes aren't real workload, they're credit-burst patterns. You read the average, not the peaks. 7.69% over 7 days.
What's left underneath is exactly what Linux does when nobody's asked it to do anything. Cron jobs, log rotation, the Azure agent phoning home. The bursts are so regular you could set your watch by them.
A VM that was actually earning its keep would look messier than this. Real work is noisy. This is a metronome.
CPU on its own is a weak signal, so look at memory and disk for the same box over the same week.
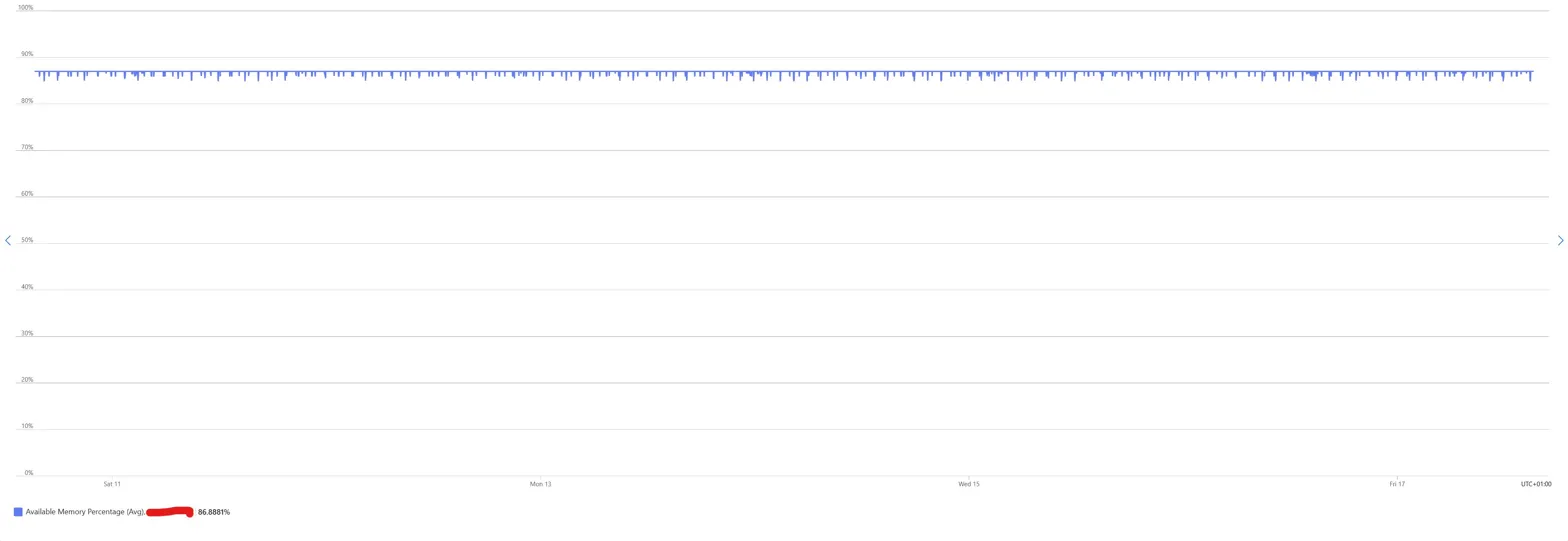
Memory sat at 86.89% available. A flat line for seven days. No peaks, no pressure, no working set churn.
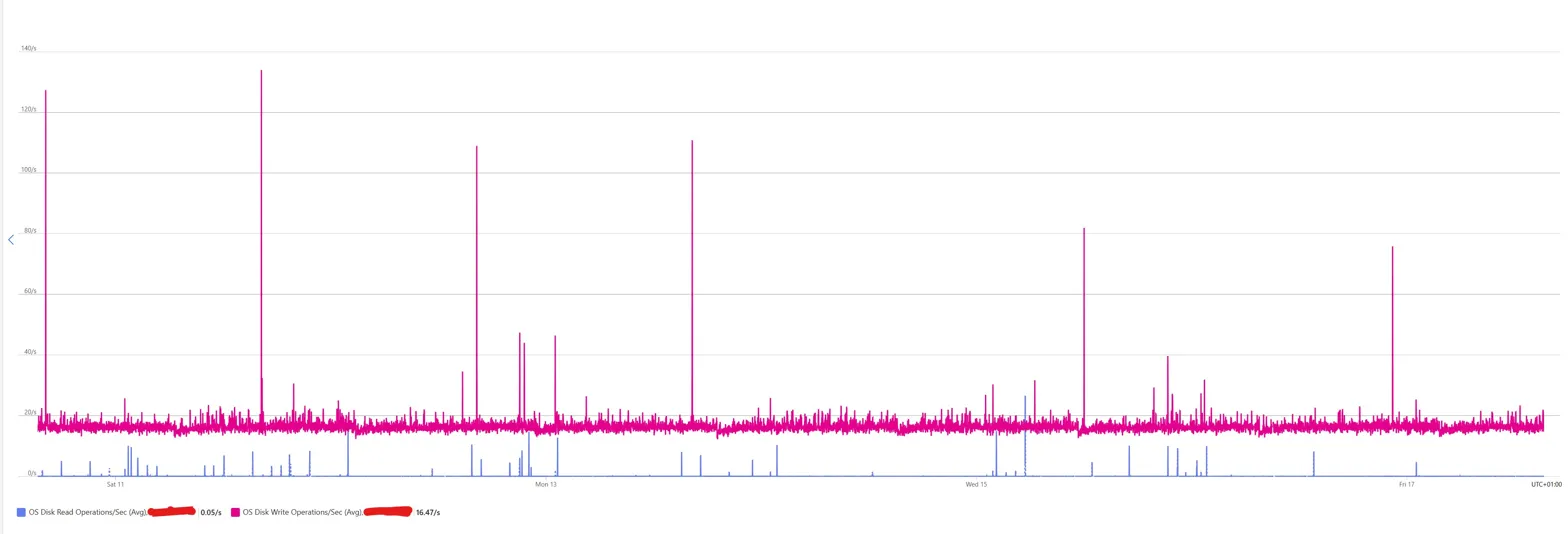
Disk writes hovered at a steady baseline of 16.47 operations per second, which is roughly what you'd expect from systemd-journald flushing its own logs and the monitoring agent writing out its heartbeats. Disk reads sat at 0.05 per second, effectively zero, because nothing was asking for data.
No weekend dip, no weekday ramp, no sign that a human or a process ever needed anything from this machine. This VM is, in every meaningful sense, idle. Not "could probably be smaller" idle. Idle idle.
Pattern recognition, not utilisation thresholds
Most tooling that flags idle VMs looks at averages. Azure Advisor's low-usage VM recommendation runs on P95 CPU and network over 14 days. Cost Management shows you averages. Third-party FinOps platforms let you set thresholds like "flag anything under 10% CPU for 7 days."
Thresholds give you a list. Patterns give you conversations.
A metronomic CPU trace tells you more than a threshold ever could. It tells you the VM is idle AND that nothing bursty ever runs. A flat memory line tells you nothing is accumulating state. A near-zero disk read line tells you nothing retrieves data. Three signals together form a silhouette that a single threshold can't capture.
Once you know what a dead VM looks like, you start spotting it from the shape of the graph before you read the numbers.
Other shapes worth spotting
Beyond the metronome, a rough gallery of shapes I see repeatedly.
The 9-to-5. CPU ramps around 8am, trails off by 6pm, flatlines on weekends. One or two humans using it. Might be a dev box, a jump host, a reporting tool. Real, but almost certainly running 24x7 when it doesn't need to. Auto stop/start lives here.
The heartbeat. Near-zero activity except one spike every 24 hours, usually around 2am. Backup window, nightly batch, scheduled report. The question isn't whether the VM is doing something. It's whether anyone still reads the report.
The honest worker. Noisy, irregular, messy. Never flat. This is what actual production workload looks like. Leave it alone.
The ghost. Flat line. No spikes at all, not even the cron-jobs metronome. Either the workload is genuinely done and the VM is still billing for no reason, or the monitoring agent has died and nobody noticed. Both are interesting.
None of these tells you what to do. They tell you which VMs are worth asking a question about.
When the pattern lies
This is where I stop myself. A VM at 2% CPU might still be load-bearing. Real examples from environments I've reviewed:
- A license server handling 40 requests a month, where those 40 requests are the difference between month-end close working and not working
- A domain controller doing exactly what a domain controller should do, which is almost nothing most of the time
- A database replica that fails over once a year, must exist, barely breathes
- A compliance artifact an auditor requires to exist, even though nothing ever reads from it
- A jumphost someone uses once a quarter for break-glass access
CPU is a signal, not a verdict. Network, disk IOPS, active sessions, listening ports, last-login timestamps all add to the picture. You layer signals and you're still building a stronger suspicion, not making a decision.
The pattern tells you which VMs are worth a conversation. It doesn't tell you which VMs to turn off.
Pattern recognition at scale
At 100 VMs, a platform team can eyeball this. At 10,000 VMs, nobody is eyeballing anything.
This is where pattern recognition becomes code. Azure Resource Graph can query VM metadata at scale. Log Analytics holds the utilisation data. You can script a weekly query that identifies VMs whose shape matches "dead" for 30 days: low average CPU, low variance, flat memory, near-zero disk reads, no logins. Drop the results into a candidate list, wire it to Teams or an email digest, and you have a cheap, continuous scanner running across the estate.
The tooling isn't hard. What's hard is the policy that sits on top of it.
What do you do with the candidate list? Who decides? How long does a VM sit on the list before someone starts a conversation? What's the silent-decommission timeline if nobody responds? Most FinOps programmes never build this because nobody's job is to look for it. The bill gets paid. The VMs keep running.
The actual interesting question
At enterprise scale, the real question isn't "is this VM idle?" It's "does anyone still need this VM?" Those are different questions and most tooling conflates them.
The CPU graph can't tell you. A scripted scanner can't tell you. The only thing that can answer is a human, specifically the human who owns the workload.
The version that works in practice is embarrassingly simple. A quarterly email to VM owners saying "we noticed your VM looks like this. Is it still doing what you need?" If someone replies yes, move on. If nobody replies in 30 days, shut the VM down. If nobody notices it's shut down after another 60 days, decommission it.
That's not a technical problem. It's a governance problem wearing a metrics costume. Which is why automation alone never solves it, and why pattern recognition turns out to be more useful as a conversation starter than as a kill signal.
A thought experiment, not a methodology
I'm not claiming you should delete every VM that looks like a metronome. I'm claiming that in an era where most large organisations have more VMs than humans who care about them, learning to read the silhouettes might be a useful conversation starter. The pattern matters less than the question it lets you ask.
In most estates I review, the quiet VMs account for 10-20% of the total VM bill. Sometimes more. Nobody had noticed because nothing alerts on quiet.
What shapes have you noticed in your own estate? What did they turn out to be?
Curious what shapes are hiding in your Azure estate? Our free cost assessment includes a utilisation audit across your VMs, with pattern-matched decommissioning candidates called out.