290 GB across 11,000 km of Azure backbone in 35 seconds of active transfer. A 25 GB Blu-ray every 3 seconds, across half the planet. That's the headline finding from this week's benchmark session, and it directly contradicts what I posted two weeks ago.
The reason this post exists: two weeks ago I pulled Jakarta to Milan at 51 Gbit/s peak, watched it settle to ~30, and wrote, in a post that did rather well, that you could see Azure's QoS shaper drag it back to 30 and hold it there. I was wrong. That wasn't a shaper. It was a single azcopy pull hitting the bandwidth-delay product on an older-generation NIC. Parallelise on a current-gen box and it vanishes. Here's the proof.
So I rented an H100 spot box (Standard_NC80adis_H100_v5, 80 vCPU, 100 Gbit NIC) in Indonesia Central, pointed azcopy at storage accounts near and far, and measured the wire with sar at one-second resolution into a 500 GB RAM disk (so disk I/O could never be the bottleneck). Here's what's really going on.
First, the clean result: intra-region
Pull from a fresh Standard storage account in the same region (sub-millisecond RTT), 4 parallel azcopy processes, 256 MB blocks:
| Metric | Result |
|---|---|
| Sustained ingress | 85.3 Gbit/s |
| Peak | 92.1 Gbit/s |
| Storage throttling (503s) | ~zero |
| CPU during transfer | ~18% mean (80 cores) |
The NIC is rated 100 Gbit; we pinned it at ~92 and held 85 sustained, with the CPU practically asleep. There is no hidden QoS cap. When nothing else gets in the way, the box does what the spec says. QoS debunked, full stop.
The headline numbers by distance
| Route | Distance | RTT | Best config | Peak | Sustained | Active window | Throttle |
|---|---|---|---|---|---|---|---|
| Intra-region | same datacenter | <1 ms | 4 proc / 256 MB | 92.1 | 85.3 | n/a | minimal |
| Jakarta → Singapore | ~900 km | 14 ms | 8 proc / 64 MB | 93.5 | 76.1 | n/a | minimal |
| Italy → Indonesia (Test 5) | ~11,100 km | 170 ms | 4 proc | 85.6 | 70 | 67 Gbit/sec (290 GB in 35 s) | moderate |
Read that table top to bottom and the whole thesis falls out. A 900 km hop is indistinguishable from same-region (76 sustained, basically zero throttling). You just add a couple more streams to fill the slightly bigger pipe. By 11,000 km the pipe is so big you'd need ~12× the connections to fill it, and that is what trips the storage throttle. Distance never slows the network; it just forces a connection count that eventually collides with the storage account's request limit. Short hop = few enough connections to stay under it = full speed. Long haul = so many it blows through it = sustain settles in the 60-70 range. Same code, same NIC, every time. Only the latency changes.
On the "active window" measurement: the 67 Gbit/sec figure is the throughput during the active transfer phase (35 seconds, read directly off the video timestamps from the spike start at 17:47:21 to spike end at 17:47:56). The full wall-clock for that run was 62 seconds; the remaining 27 seconds were eaten by azcopy pre-allocating the RAM-disk destination files at the start (about 13 seconds of CPU-bound zeroing) and tail drainage of the last files at the end (about 14 seconds). All three numbers (peak, sustained, active-window) are honest descriptions of different aspects of the same run, and they explain each other.
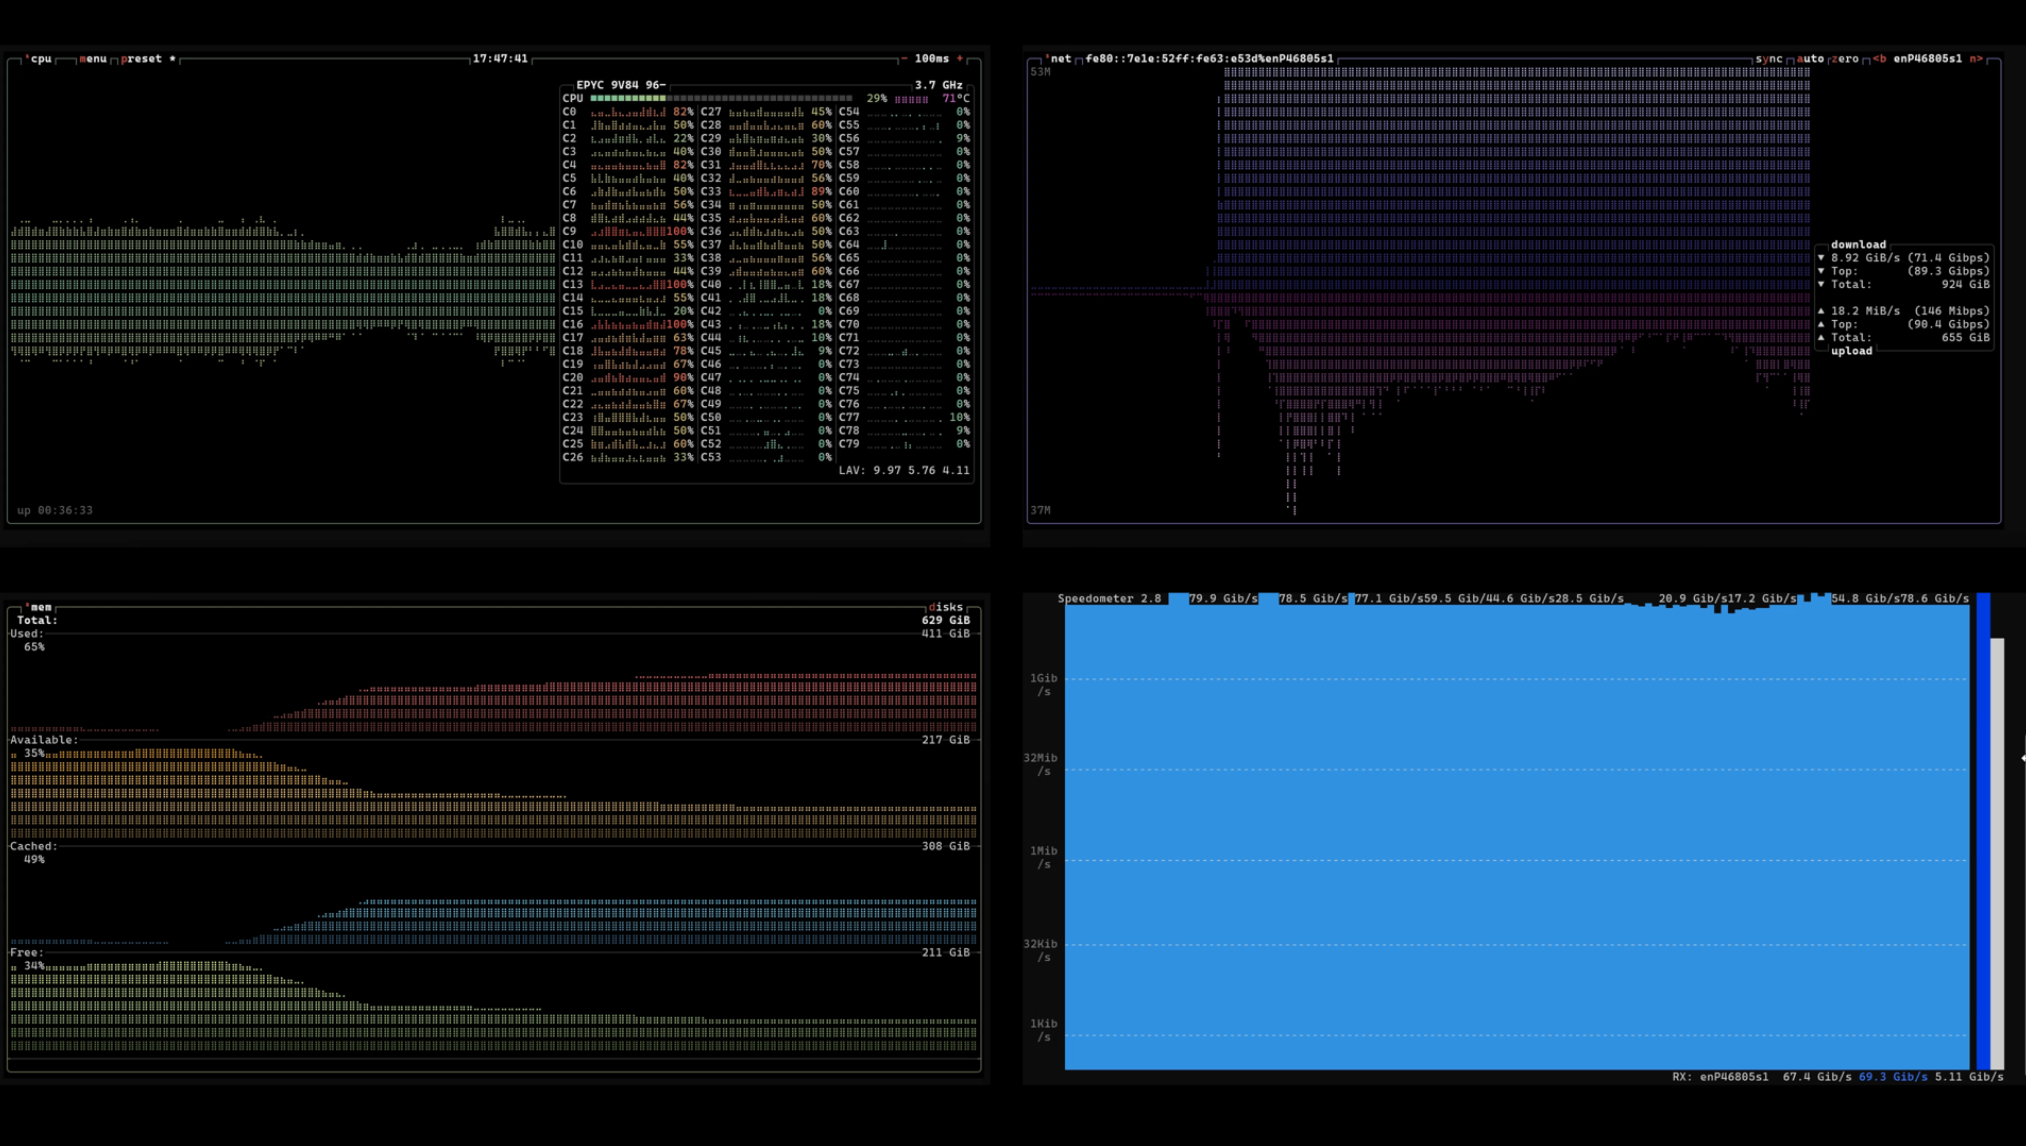
Click image to play the active transfer clip.
What the distance actually costs you: the peaks hold at 80 to 93 Gbit/s at every distance measured. The backbone wire is never the bottleneck. What distance erodes is the sustained number, and only indirectly: longer RTT forces more connections, more connections mean more requests per second, and that's what trips the storage account's request throttle. At 11,000 km the sustained number lands in the 60 to 70 range during the active transfer window. Take storage out of the path (VM-to-VM), or move to a new Azure Boost SKU (200 Gbit NIC + hardware offload), and 100 Gbit/s+ looks well within reach. That's the next test.
A second long-haul leg (West Europe → Indonesia Central, ~11,400 km) using a different config sweep (8 proc / 8 MB blocks) sustained closer to 57 Gbit/sec but with much heavier 503 throttling (531 events in a 40-second window). Same physics, different operating point on the trade-off between parallelism count and per-request size. Smaller blocks = more requests per second = sooner you hit the throttle. The Italy → Indonesia Test 5 run (4-process, larger blocks) sat in a sweeter spot of that trade-off, which is why it sustained higher.
The long haul: 11,000 km, config by config
Same VM, pulling from a fresh storage account in West Europe (~11,000 km, 170 ms round-trip). Across a sweep of configurations:
| Config | Peak | Sustained | 503 throttle events |
|---|---|---|---|
| 4 proc / 256 MB blocks | 43 | 25 | 4 |
| 6 proc / 64 MB blocks | 80 | 36 | 23 |
| 8 proc / 8 MB blocks | 81 | 57 | 531 |
| 2 stamps / 8 proc / 16 MB | 83 | 36 | 177 |
We touched 83 Gbit/s over 11,000 km. That alone kills the "Azure caps long-haul links" myth. But we couldn't hold 80. The sustained number sat in the 35 to 57 range, and the reason is the whole point of this post: three real walls, none of them a QoS shaper.
Wall 1: the speed of light (this is the physics part)
A TCP connection can only have one "window" of data in flight per round-trip. Throughput per flow = window ÷ RTT. At 170 ms, to fill 80 Gbit/s you'd need ~1.7 GB in flight on a single flow, and TCP can't open a window that big. A single flow over a long-haul path collapses to well under 1 Gbit/s. The BDP math is brutal and there's no config that fixes one connection.
That's not Azure. That's Claude Shannon and the speed of light. The fix is parallelism: fan out into hundreds of concurrent transfers so the aggregate fills the pipe. Intra-region (sub-ms RTT) you need almost nothing in flight, so one fat stream nearly saturates the NIC. Cross-region you must shard into many small requests. Remember that, it's what trips wall 2.
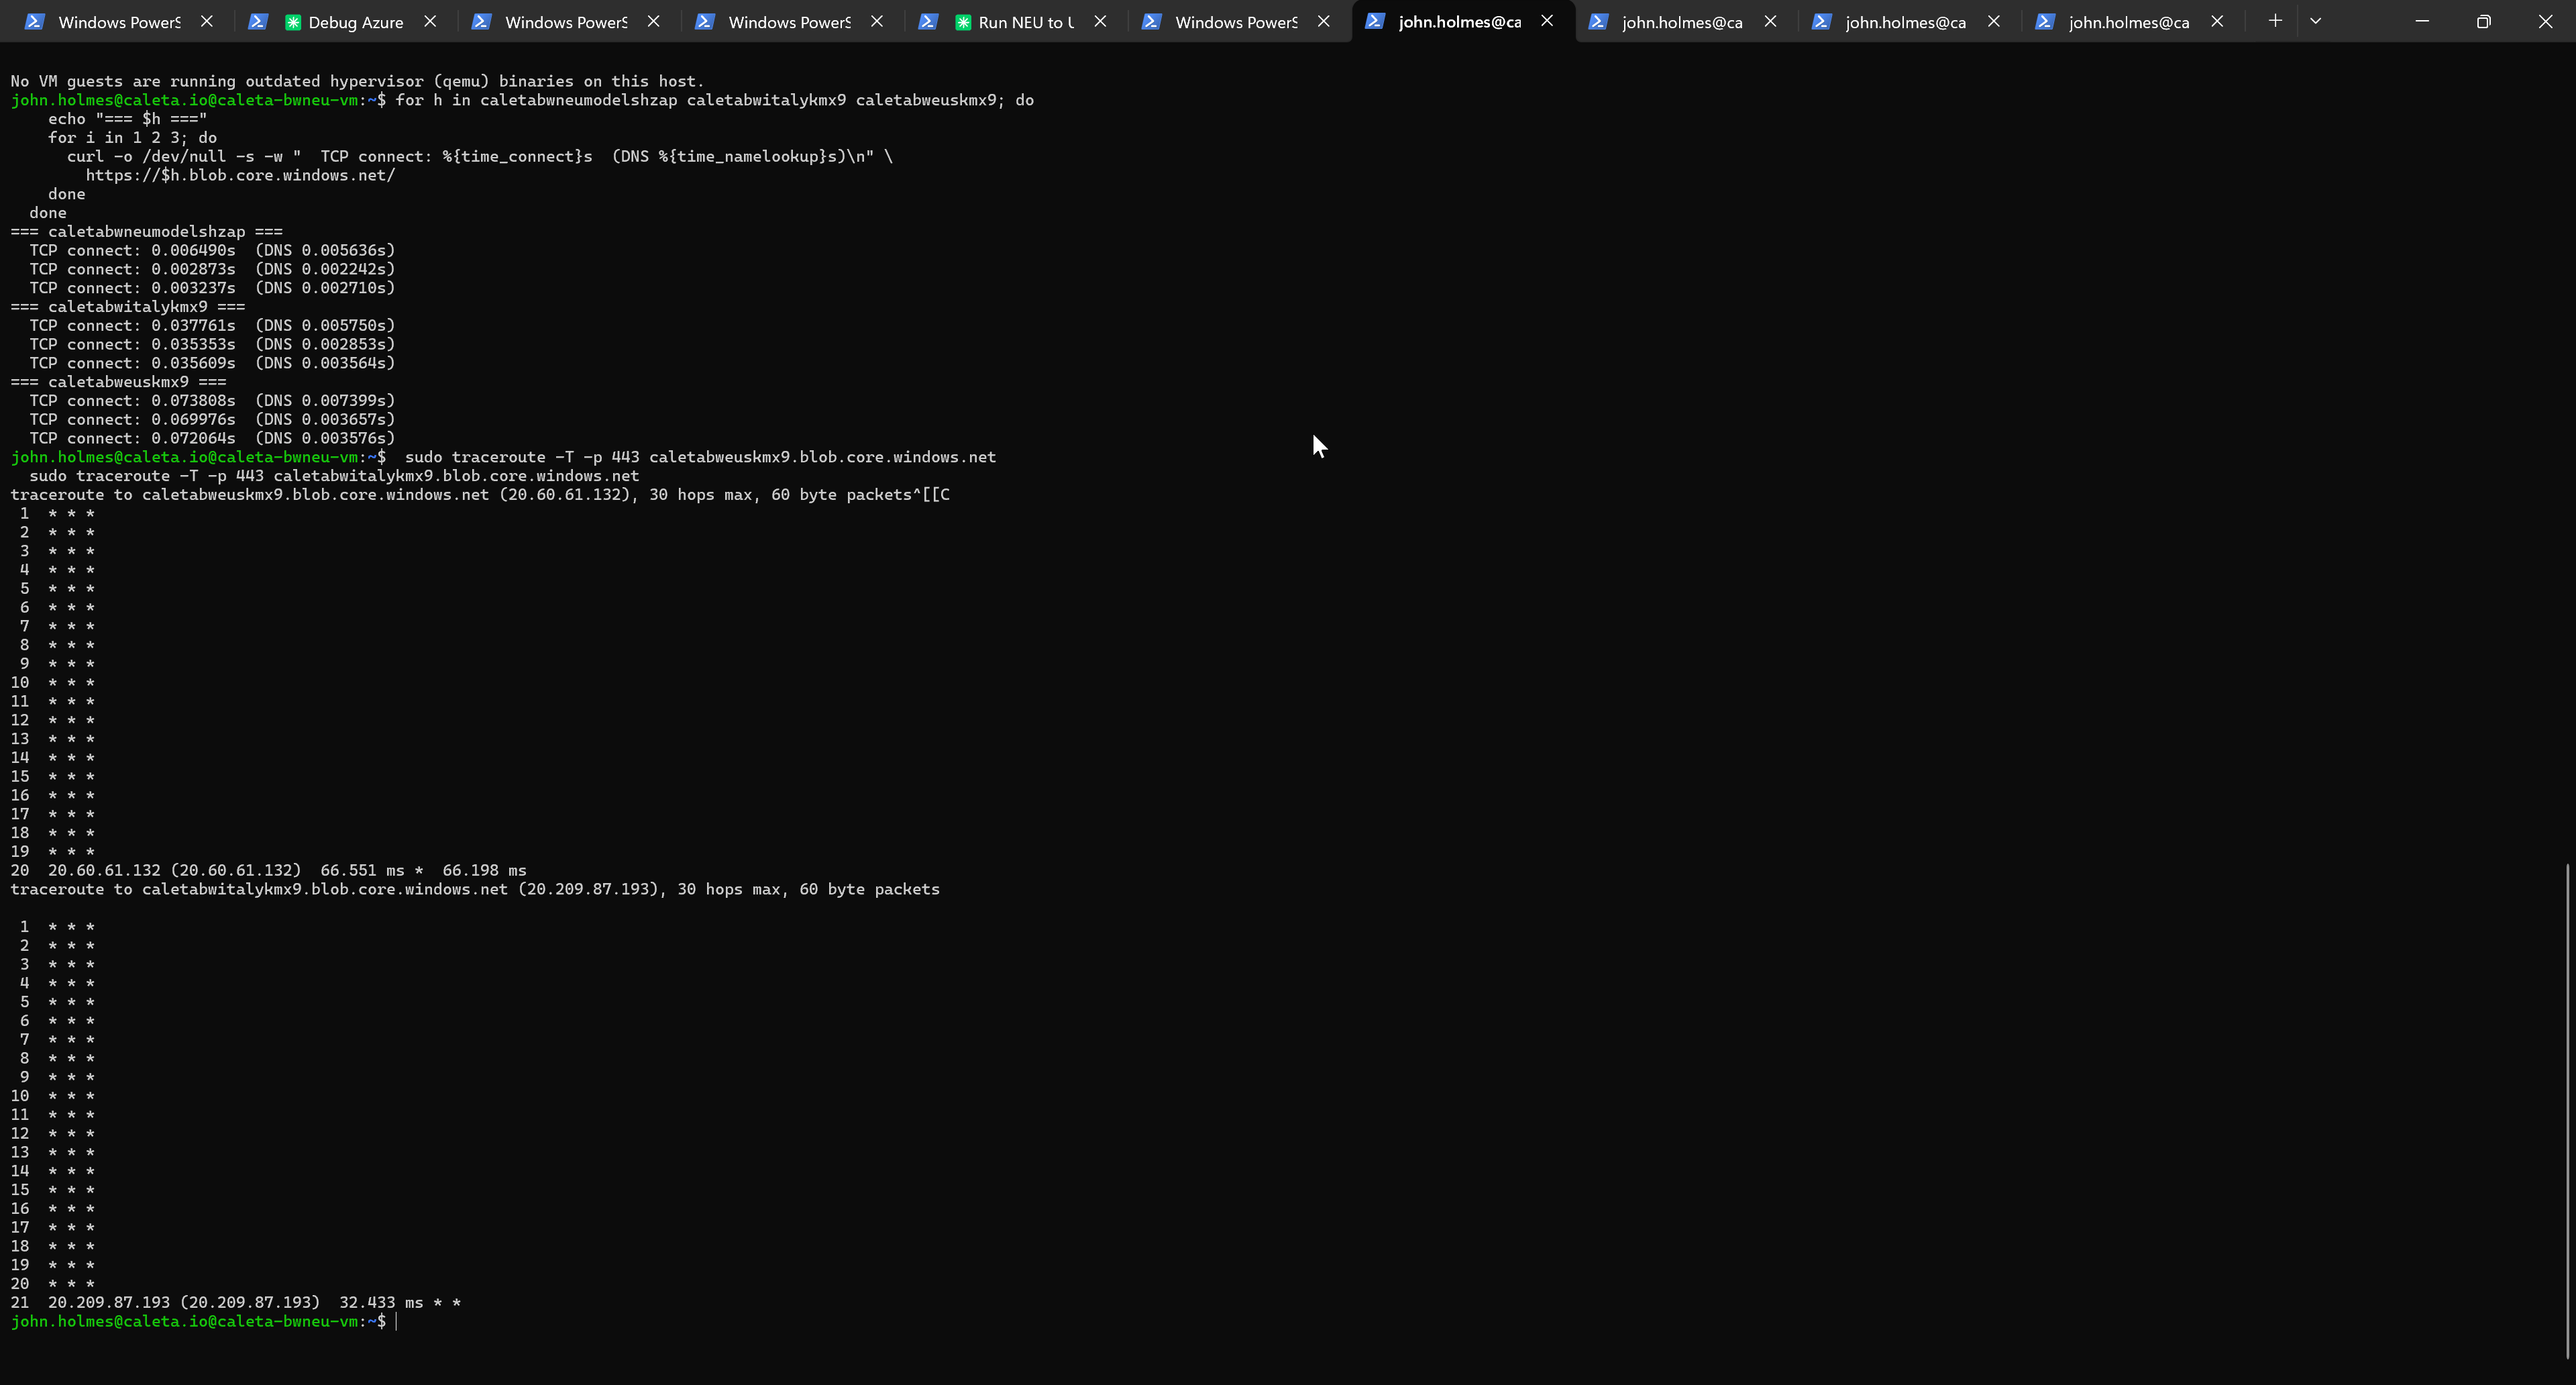
The traceroute output above (TCP traceroute on port 443) is what you get if you try to map an Azure backbone path: 20 hops of * * * followed by a single response at the destination edge. Azure blocks ICMP on internal hops by design, so the route is opaque to standard tooling. The TCP-connect tier structure (3 ms intra-region, 36 ms Europe-to-Italy, 70 ms transatlantic) gives you the latency reality from a completely different measurement angle and validates the RTT numbers in the table above.
Wall 2: the storage account's request limit (this is the engineering part)
Once we parallelised hard enough to beat the BDP, the storage account started returning 503 ServerBusy (531 of them in one 40-second window). Throughput cratered as azcopy backed off.
Here's the question everyone asks: how does the storage account know the request came from another region, so it can throttle it?
It doesn't. It has no idea where you are, and it doesn't care. The 503 is decided locally at the storage stamp, purely on request rate. A request from a VM in the same datacenter and one from the far side of the planet are byte-identical to the throttling logic.
The connection to distance is indirect: to fill a 170 ms pipe you're forced into small blocks × many processes, which means firing thousands of requests per second at the account, and any account, near or far, throttles that. Look at the data: intra-region moved the same 300 GB with big blocks and a low request rate, near-zero 503s. Cross-region needed small blocks to get the flow count, 531 503s. Same account type, same bytes. The only variable that changed was how many requests per second, and that's the one thing the throttle reacts to.
Azure didn't throttle me for being far away. Distance forced me to hammer the account with requests to beat the latency, and request rate is what every storage stamp throttles on.
Wall 3: the real one, your CPU, not your NIC
Watching live, the CPU pegs 100% across all cores at the start of every pull, but that's a red herring. It's azcopy pre-allocating the destination files (zeroing RAM-disk pages) before any data moves; mpstat confirms it (all-core mean 18 to 24% during the actual transfer). So far, so boring.
But there's a real wall hiding underneath, and I almost missed it. On the same-region pull at 92 Gbit/s with a few fat streams, one core's softirq pegs at 100%, pinned, sustained, doing nothing but processing packets. Run the same throughput with more, smaller streams and that load spreads across cores and drops to ~40% each. In other words: what I'd been calling "pinning the NIC at 92" is really pinning the single core that processes the packets. The wire has more to give; the host's packet path doesn't.
That reframes the whole intra-region story. The ceiling isn't the NIC, it's softirq on the hot core. So the way past it isn't a bigger NIC; it's (a) spreading the load across more streams, and (b) hardware network offload (Azure Boost, on the new Dnsv6/Ensv6 SKUs) which lifts packet processing off the host CPU entirely. That's the next experiment, and the opener for the sequel: I hit the wall at 92, and it wasn't the wire, the distance, or a QoS cap. It was my own CPU.
A note on what I'm not claiming
I tried to push this further on a second leg (a different long-haul route, across a different subscription, reading from freshly-created storage accounts) and I ran into enough confounds to not trust the numbers. Brand-new storage accounts have a warm-up: their egress target ramps over time, and a cold one hard-clamps to a couple of Gbit/s no matter what you throw at it. Stack that on top of a different subscription's billing path and a different region pair, and you're no longer comparing like for like. So I'm deliberately leaving that leg out rather than dress up a messy result as a clean one. The Indonesia Central numbers above are the controlled set. If there's appetite for a properly-isolated transatlantic rerun (one variable at a time) I'll do it and report it on its own.
The real bill: bandwidth, not compute
Azure's backbone is fast. Azure's backbone is not free. Here's the actual cost breakdown from these tests, pulled from the usage CSV:
| Category | Volume | Cost |
|---|---|---|
| Inter-continent egress (Asia to anywhere) | 961 GB | £76.85 |
| Inter-continent egress (NAM/EU to anywhere) | 704 GB | £35.21 |
| Intra-continent egress | 5.6 GB | £0.12 |
| All inbound transfers | 344 GB | £0.00 (always free) |
| H100 spot compute | ~8.6 hours | pennies |
| Bandwidth total | ~1.7 TB | ~£112 |
Two things jump out.
First, Asia outbound costs ~60% more per GB than NAM or EU outbound (£0.080/GB vs £0.050/GB at list). The Indonesia to Europe pulls were significantly more expensive than the equivalent Europe to Asia pulls would have been. If you're designing a cost-aware architecture for cross-region workloads, the source region is a meaningful cost lever, not just a latency lever.
Second, inbound is free in every direction. Always. That sounds obvious until you trace through the implications. Pulling data INTO your VM costs nothing. Pushing the same data OUT in the other direction costs money. If your architecture has a choice between "VM pulls from far storage" or "VM in storage's region pushes to far VM", the first one is free and the second isn't. Same bytes, different bill.
These are list prices. Reserved capacity, ExpressRoute, and enterprise discounts lower them. But at list, a single 300 GB transfer out of Asia costs around £24. Five test runs to get clean numbers, and you've burned £120 before you've measured anything.
The backbone is fast. The data movement is the bill.
So what's the real verdict?
There is no secret QoS shaper. There are three real, measurable walls:
- The speed of light sets the rules. Long RTT means you must parallelise to fill the pipe (peak limited by BDP).
- The storage account's request limit sets the cross-region ceiling. The parallelism that beats wall 1 fires so many requests it trips the throttle that caps the sustain. (Short hops never hit this; they need too few connections.)
- The host's packet-processing core sets the same-region ceiling. At 92 Gbit/s it's softirq on the hot core that's maxed, not the NIC.
So: short hop ≈ same-region (76 to 85 sustained, softirq-bound); long haul peaks 85+ but the storage throttle claws the sustain back to the 60 to 70 range over 11,000 km (67 Gbit/sec measured against video timestamps for the Italy → Indonesia run, the cleanest data set); and the wire itself was never the bottleneck at any distance.
Two open questions, two next experiments: (1) sustain 80 across 11,000 km by sharding the source across 4 to 8 storage accounts so no one stamp hits its request limit; (2) break the same-region 92 ceiling with a new-gen Azure Boost SKU (Dnsv6/Ensv6) that offloads the packet processing, measured VM-to-VM, no storage in the path at all.
Which is where you come in. Want the 8-account shard, the Azure Boost VM-to-VM run, or a route/SKU/tier I haven't touched? Tell me in the comments. If there's appetite, that's the next post.
Measured on Azure NC80adis_H100_v5 spot, Indonesia Central, June 2026. azcopy to 500 GB tmpfs, throughput via sar -n DEV 1 on the accelerated-networking VF. Synthetic payloads (truncate-fabricated), content is irrelevant to bandwidth. Every VM and test account destroyed at session end. Full cost breakdown is above; bandwidth charges dwarfed everything else.
Cross-region egress is one of the biggest hidden costs in Azure estates we review. Workloads designed around fast intra-region copies look cheap in dev/test and then bleed when production traffic crosses continents. If you want a read-only look at where your bandwidth spend is going, our free Cost Review identifies patterns like this alongside compute, storage, and PaaS waste.
Got something out of this? Prefer to chat about your specific patterns rather than fill in a form? Ping me on LinkedIn, I'm always up for a benchmark conversation.