A few days ago I showed that GLM-5.2, a 744-billion-parameter open-weight model, matches Claude Opus on real Terraform generation, running on one cheap Azure GPU box instead of a frontier API. The obvious follow-up, which a lot of you asked: how far can you crush it before it breaks?
So I quantised it down a ladder, from about 3.3 bits-per-weight down to a brutal 1.56 bits, and measured what intelligence you actually lose at each step.
The headline isn't "it gets dumber as you shrink it". It's more useful than that. Compression damage is nearly invisible on benchmarks and clear on real work. Multiple-choice and maths benchmarks stayed flat across the whole range. But generating working infrastructure code slid from 82% to 71% as I crushed it. Test on your task, not a leaderboard.
Setup
- Model: GLM-5.2, 744B total, about 40B active (MoE), MIT-licensed, Unsloth dynamic GGUF quants.
- Box: one 4×A100 Azure VM, about $3.53/hr spot. Cheap, self-hosted, in your own tenant.
- The ladder: four quants that fit fully in VRAM, from IQ1_S (1.56 bpw, about 145 GB) to IQ3_S (3.3 bpw, about 307 GB). The near-lossless Q4 (87%) needs more memory than this box has. More on that below.
- What I measured: real Terraform generation (does
terraform planpass), plus MMLU-Pro and GSM8K, plus raw serving speed.
Everything single-shot, thinking-off, same seeds. Apples to apples across quants.
Finding 1: the two curves that tell the whole story
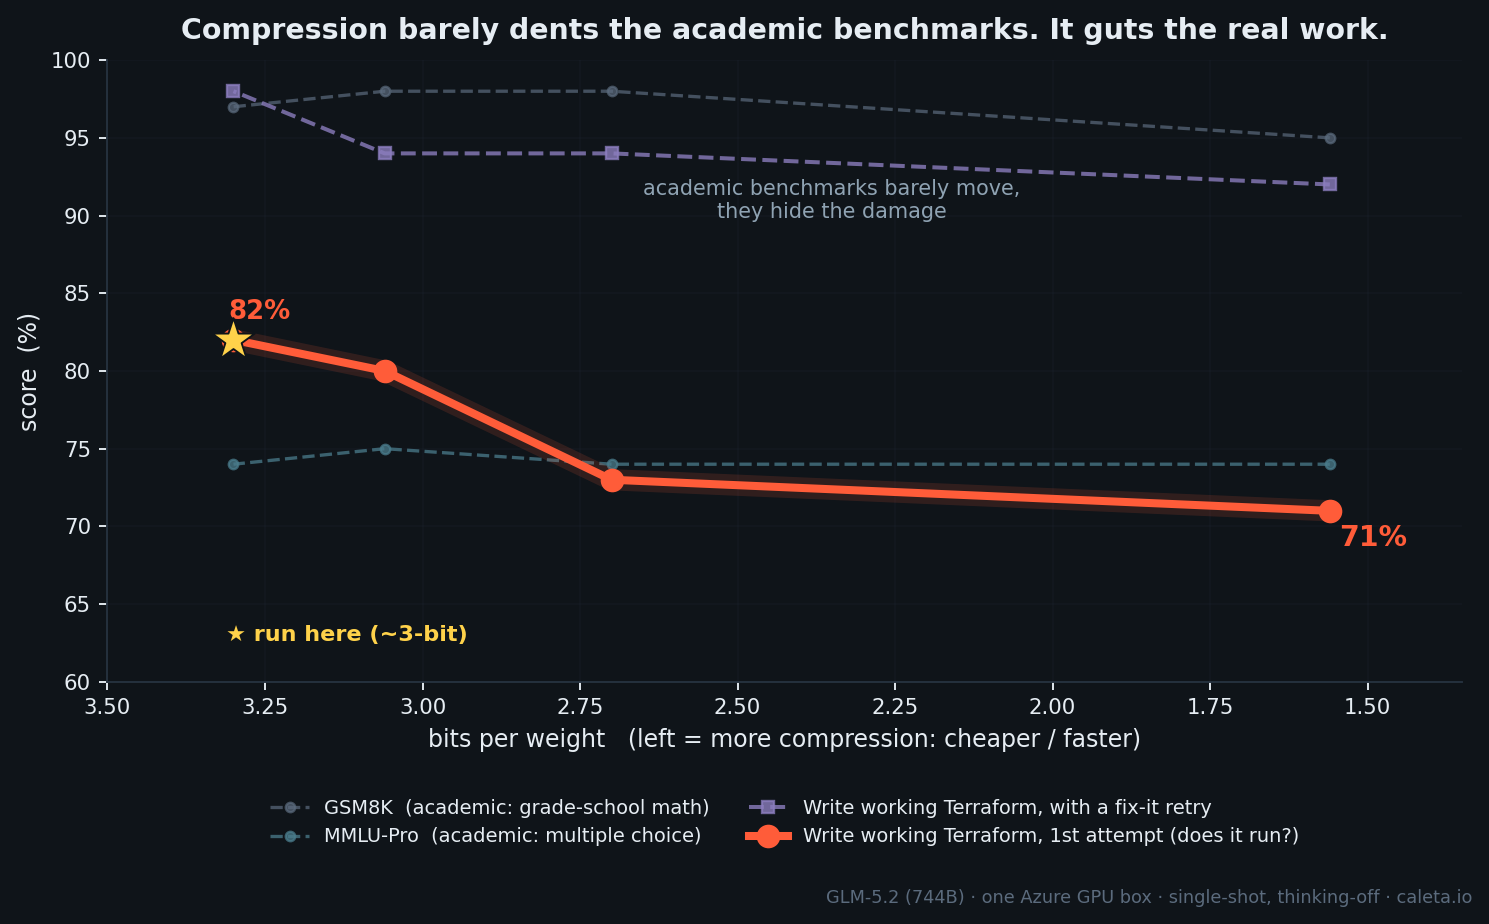
| Quant | bits/weight | Terraform (does it run?) | MMLU-Pro | GSM8K |
|---|---|---|---|---|
| IQ1_S | 1.56 | 71% | 74% | 95% |
| IQ2_M | 2.70 | 73% | 74% | 98% |
| IQ3_XXS | 3.06 | 80% | 75% | 98% |
| IQ3_S | 3.30 | 82% | 74% | 97% |
Two completely different shapes on the same model, same prompts:
- The benchmarks are flat. MMLU-Pro sits at 74% and doesn't move. GSM8K stays around 97%. By a leaderboard, crushing the model to 1.56-bit costs nothing.
- The real work is a slope. Generating Terraform that actually validates and plans falls a clean 11 points, 82% down to 71%, as you compress it.
Why the benchmarks hide it and your real work doesn't
There's no paradox once you see the mechanism.
Multiple choice is forgiving. The model only has to keep the right answer as its top pick out of ten. Compression adds noise to its confidence, but as long as the correct option stays on top, even by a hair, the score doesn't change. Multiple choice hides the damage.
Generating code is unforgiving. Every token has to be right. One wrong argument and terraform plan fails. There's no margin, so the same noise that multiple choice shrugs off accumulates into failures. Real generation exposes it.
The damage is happening both times. A multiple-choice score is just too coarse to see it. "Does the code run" catches it. This is the part most "is the quantised model still good?" takes get wrong. They quote a benchmark that was never going to move.
Finding 2: it's really a memory-bandwidth story, which is why it also runs faster
Watching the box work reframed the whole thing. When the model is fully in VRAM, the server is nearly idle. CPU barely ticking, host RAM empty, even the GPU's math units mostly waiting. Token generation isn't compute-bound, it's memory-bandwidth-bound: every token, the GPU reads all of the roughly 40B active weights out of memory.
- At 2.7-bit, that's about 13.5 GB read per token.
- At 1.56-bit, about 8 GB per token.
Fewer bytes to move means more tokens per second. Compression buys speed by shrinking the per-token memory read. That's the physical reason a smaller quant runs faster.
I watched the power meter too: one GPU flickering between 90 W and 280 W a hundred times a second, at max clock the whole time, drawing a quarter of its rated power on average. Not because it's throttled, because it's starved, waiting on memory between brief compute bursts. You can't overclock your way past a bandwidth wall.
Then there's the spill cliff. VRAM moves data at about 2 TB/s. Host RAM over PCIe does tens of GB/s. The moment your model doesn't fit VRAM, like the near-lossless Q4, every token drags weights across the slow bus. CPU pegs, throughput collapses from about 28 t/s to 8. Same model, slower wire. That's why the 87% Q4 is off the chart above: it's the best quality, but it won't fit, so it isn't servable for a team on this box.
Finding 3: you can trade bits for retries, with one asterisk
The low quants look rough single-shot. But give the agent one more attempt with a real checker in the loop (terraform validate and plan) and most of the gap comes back.
| Quant | single-shot | with a fix-it retry |
|---|---|---|
| IQ1_S (1.56) | 71% | 92% |
| IQ2_M (2.70) | 73% | 94% |
| IQ3_S (3.30) | 82% | 98% |
The cheaper the quant, the more the retry loop earns its keep. A 1.56-bit model plus a verifier is roughly a near-lossless model first-try.
The asterisk: this only works because there's a verifier. Terraform validates, code compiles, tests pass, a real signal a retry can exploit. Bolt the same loop onto open-ended work with no checker and self-correction can make things worse. So trade bits for retries on tasks you can verify, which is most agentic infra and coding work.
Finding 4: serving a team off one box
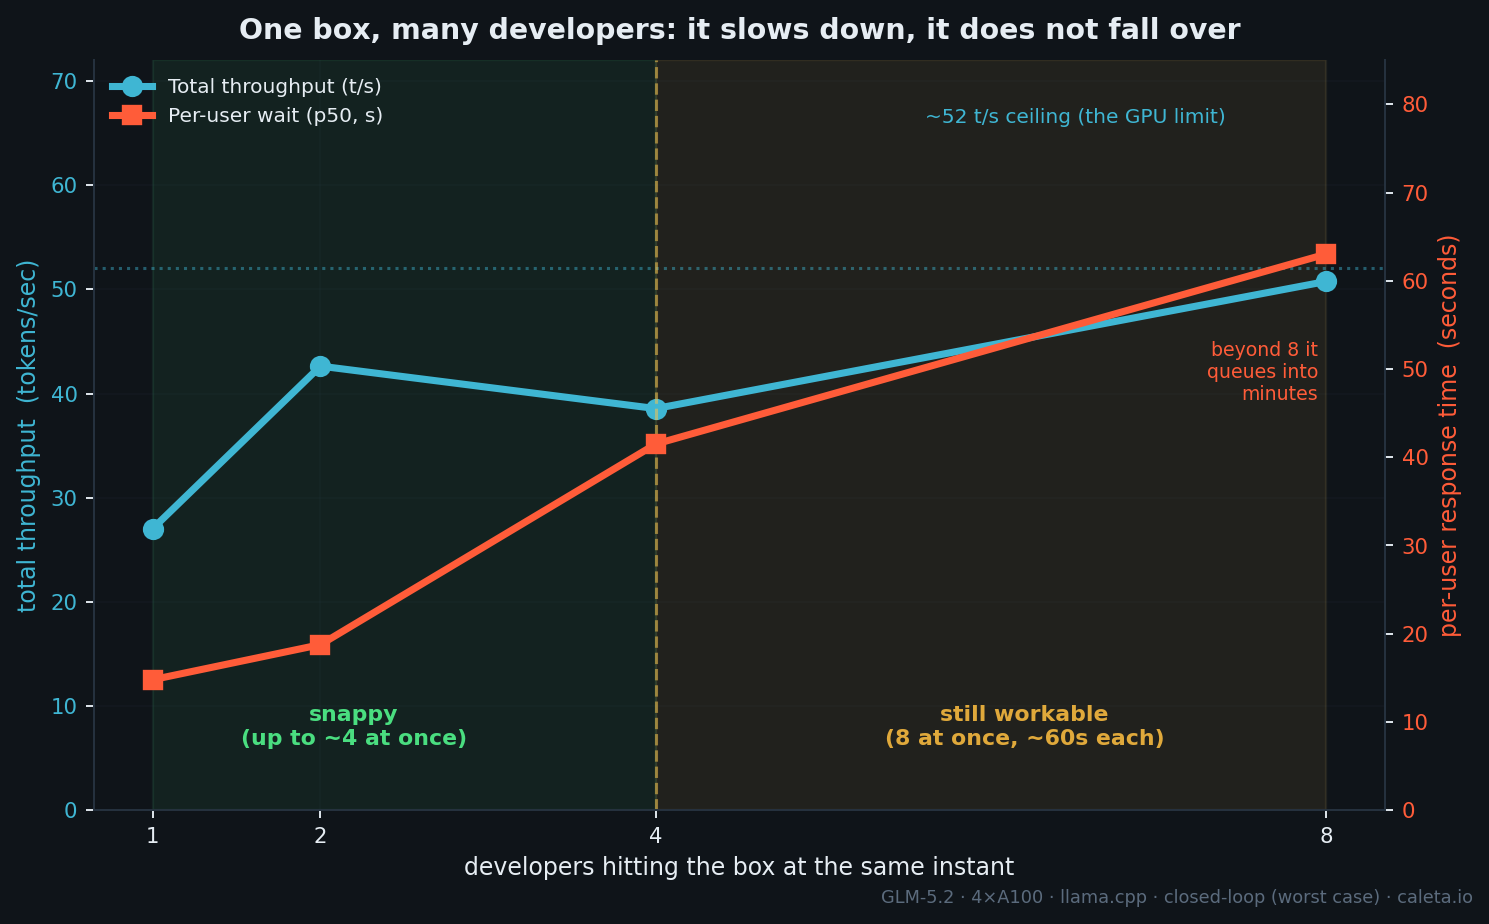
The other question I keep getting: can one box serve a team?
I fired requests at one box at increasing concurrency. Total throughput tops out around 52 tokens per second, that's the GPU's ceiling, and it gets split across everyone. So the pattern is: throughput saturates, and past about 4 simultaneous users you don't get more work done, each user just waits longer. First token stays fast, about 2 seconds, but the streaming slows. At 8 users hammering non-stop it's about 6 t/s each. It's a latency wall, not a quality cliff.
Here's the thing though. Real developers don't hammer non-stop. They fire a request, then read, edit, think for 10 to 60 seconds. So the handful of simultaneous requests a team actually generates is far below its headcount. On that basis, one box comfortably covers 20+ developers across a working day, and honestly it surprised me how well it held 8 at once.
The cost is where it gets silly, and let me be precise about it. About $600 a month for the box. That's the spot rate at business-hours usage, roughly 160 hours a month, shut off overnight. So under $30 per developer. Spot means it can be evicted, so if you want to remove the eviction gap entirely you run a second box for failover, about $1,200 a month, still under $60 a developer. Either way it's a fixed, forecastable bill, not a per-token meter that climbs with every agent step. That's not "cheaper than Copilot", a Copilot seat is around $20 a month. It's frontier-class and sovereign for near-commodity money.
That's a stress test, everyone hitting it at once, plus a reasonable read on bursty real usage. A proper open-loop load test is the clean way to pin the exact seat count, and it's next.
So what should you actually run?
First, how the quants fit one roughly $3.50/hr box (320 GB VRAM): the model weights, and what's left for the KV cache that serves concurrent users.
| Quant | model in VRAM | free for KV cache |
|---|---|---|
| IQ2_M (~2.7-bit) | ~223 GB | ~90 GB, plenty for a team |
| IQ3_XXS (~3-bit) | ~263 GB | ~50 GB |
| IQ3_S (~3.3-bit) | ~290 GB | ~25 GB, tight |
| Q4 (~4.8-bit) | ~436 GB | doesn't fit, spills to host RAM |
That KV headroom is what decides how many people you can serve at once. So the recommendation splits by use.
- Serving a team: IQ2_M (~2.7-bit). About 90 GB of KV room means lots of concurrent users, and 94% with a verify-and-retry loop. This is the quant behind the concurrency numbers above. For agentic coding, where you've got
terraform validateand tests in the loop anyway, it's the sweet spot. - Solo or max quality: IQ3_S (~3.3-bit). Best score (82% first-try, 98% with retry), but only about 25 GB for KV, so fewer concurrent sessions.
- Skip Q4 on this box. Q4 (~4.8-bit) is better, 87%, near-lossless, but it doesn't fit 320 GB, so it spills to host RAM and crawls at about 8 t/s. Q4 wants a bigger (640 GB) box.
- Don't crush to 1.56-bit for real code. That's the 71% "guts it" end, fine for chat, too lossy for code unless you lean hard on retries.
The rule: fit the biggest quant you can into VRAM, leave headroom for the KV cache if you're serving a team, and run a verify-retry loop. For coding on this box that's roughly 2.7 to 3.3-bit GLM-5.2, doing real infrastructure code at 94 to 98%.
And the deeper point: the expensive part was never the model or the CPU. It's fast VRAM, and whether your model fits in it.
What this looks like deployed
The benchmarks above ran on a single spot box, the test rig. The productionised version for regulated work is the same model in an isolated, hardened enclave: its own subscription, no public IP, Entra-only access, locked-down storage over private endpoints, and egress denied so nothing leaves your boundary. Here's the shape.
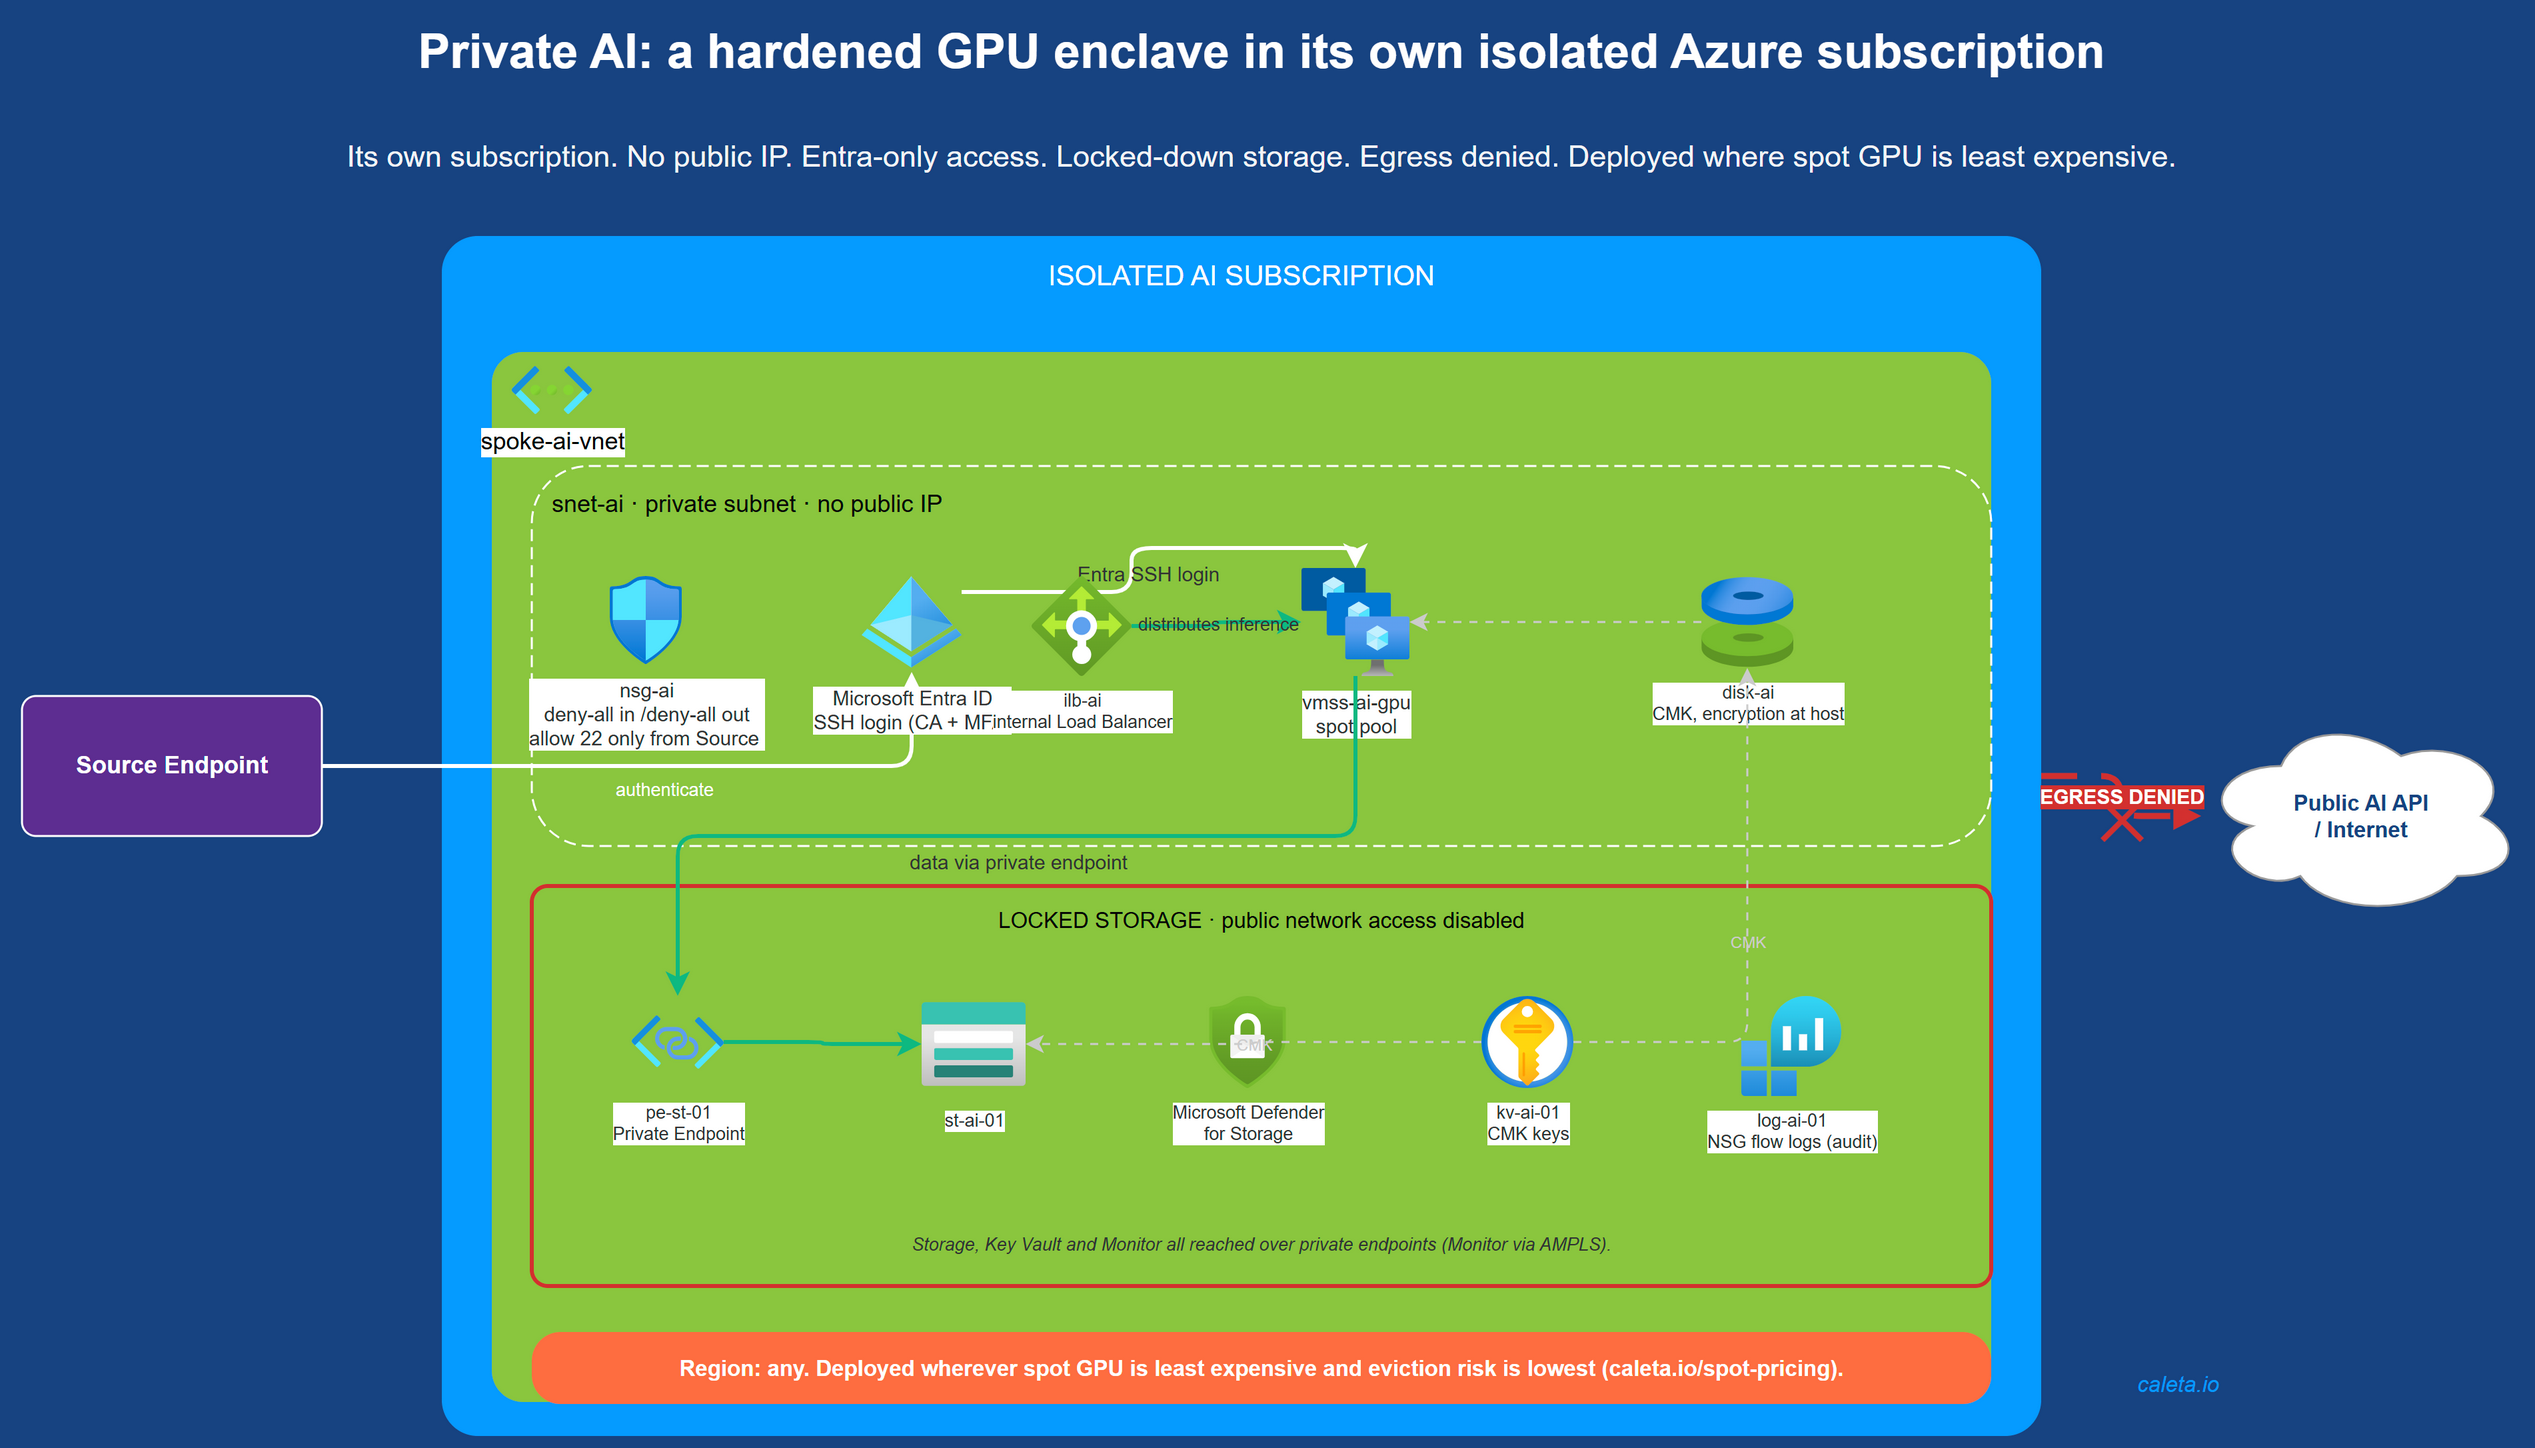
This hardened, in-tenant deployment is the service I'm building for regulated UK and EU teams that can't put their data through a public AI API: frontier-class intelligence inside your own boundary, provably locked down, on infrastructure you own.
Caveats, because the numbers deserve them
- These are relative comparisons under one fixed harness (thinking-off, capped generation, same seeds). The flatness across quants is the finding, not the absolute benchmark level. Thinking-on and a standard harness score higher.
- Concurrency was a closed-loop stress test (users hitting it non-stop, worst case). Real bursty usage is lighter, so the seat estimate is a floor. Exact seat count needs an open-loop load test, which is next.
- Context-window and long-context coherence are not tested here. That's a separate experiment and a separate post. This is about compression cost and serving economics.
- Spot isn't production. This box can be evicted, it was, twice, and recovery took about 10 minutes because only the weights are ephemeral. Production means on-demand, or spot plus failover.
What's next
- A proper open-loop load test, with realistic arrival rates, for a bulletproof "requests per second to seats" number.
- The spill sweet-spot on a DDR5 and PCIe-Gen5 host: how much can you offload to fast RAM and stay usable?
- Long-horizon agentic coherence. Several of you run GLM-5.2 on multi-step chains in production. That's the one I most want to measure next, self-hosted, unmetered, on one box.
The same cost-discipline lens that finds an Opus-class model for $30 a developer is the one we bring to your whole Azure bill. If you want to know where your cloud spend is actually going, run a free Cost Review. Read-only, no obligation.